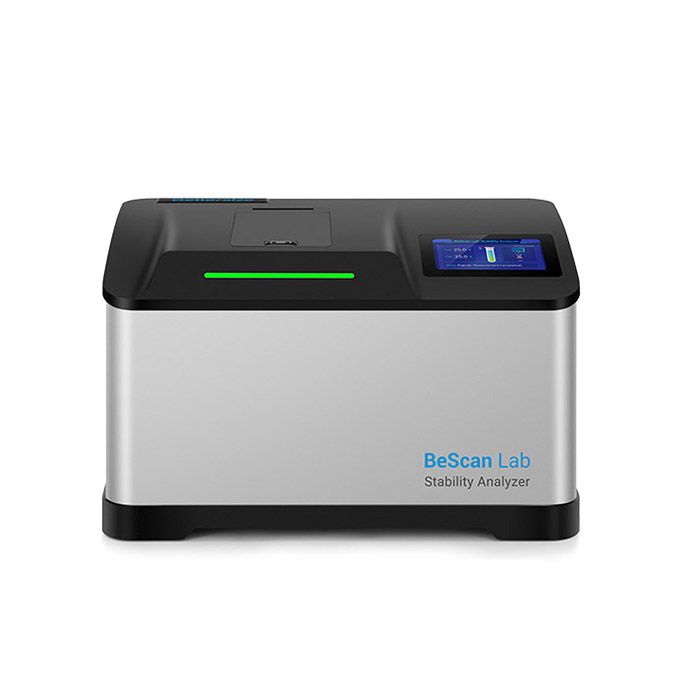
BeScan Lab
Bettersize BeScan
Stability Analyser
- Particle range 0.01 to 1,000 μm
- Non-destructive stability analysis
- Quantification of destabilisations and study of kinetics
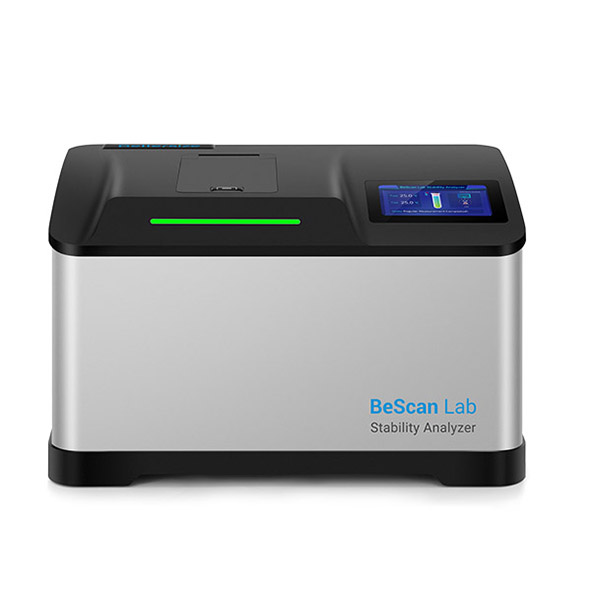
BeScan Lab, the versatile, sensitive, and reliable stability analyser based on Static Multiple Light Scattering (SMLS) technology, is widely used in the formulation development and product quality control. It accommodates a wide range of sample concentrations up to 95% v/v and types such as emulsions, suspensions, and foams, with temperature scanning capabilities reaching up to 80 °C. BeScan Lab provides both qualitative analysis and quantification of destabilisation, helping you monitor long-term product stability and achieve optimal shelf life.
Features and Benefits
● Real stability analysis for dispersions with volume fraction up to 95%
● Particle size measurement range from 0.01 to 1,000 μm
● Non-destructive stability analysis: Non-contact, non-dilution, non-shearing
● 20 µm resolution data acquisition enables quicker sample stability observation than the naked eye
● Temperature control up to 80 °C to accelerate destabilisation
● Identification of various unstable phenomena: creaming, sedimentation, flocculation, coalescence, and phase separation
● Quantification of destabilisations and study of kinetics
-
Key Features
What BeScan Lab Provides?
- lnstability index (lus)
- Mean particle size
- Hydrodynamic analysis
- Radar chart for regional lus
- Temperature trend testing
- Particle migration rate
Why You Need It?
From Raw Materials to Finish
BeScan Lab plays a crucial role throughout the product lifecycle, supporting formulation, production, and pre-use stages. It enables formulation optimization, quality control during manufacturing, investigation into optimal transportation and storage conditions, and research on redispersibility
1. Research and development
Ensure excellent dispersibility and uniformity through raw material selection.
2. Production and quality control
Optimize production processes, including method, time, and temperature, to enhance efficiency.
3. Storage and transportation
Evaluate formulation stability under varying environmental conditions, observing destabilization, and predict shelf life.
4. Pre-use treatment
Study the reversibility of destabilization and compliance with usage standards.
Features & Benefits
Non-destructive stability analysis for various dispersions
- Non-contact, non-dilution, non-shearing
- Sample volume fraction up to 95%
- Particle size measurement range from 0.01 to 1,000 μm
Fast and direct stability measurement
- The high-performance LED and ultra-sensitive detectors, with a 20-micron scan step, allow real-time monitoring and capture of subtle variations 200 times faster than the naked eye
- Temperature control up to 80 °C to accelerate destabilization
Qualitative and quantitative stability results
- Identification of various unstable phenomena, such as creaming, sedimentation, flocculation, coalescence, and phase separation
- Quantification of destabilizations and study of kinetics
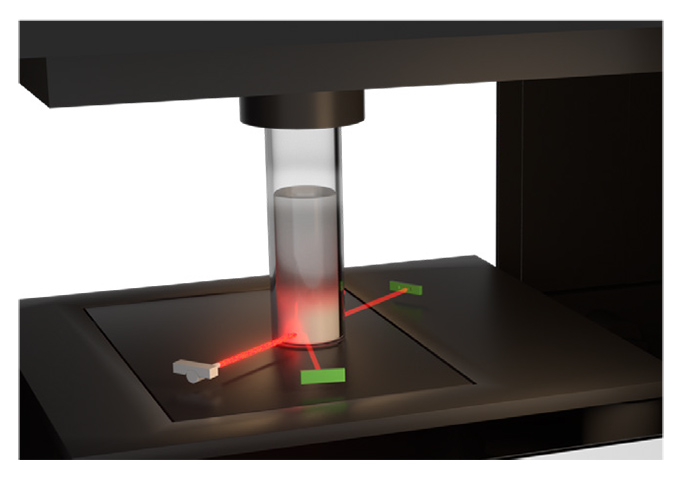
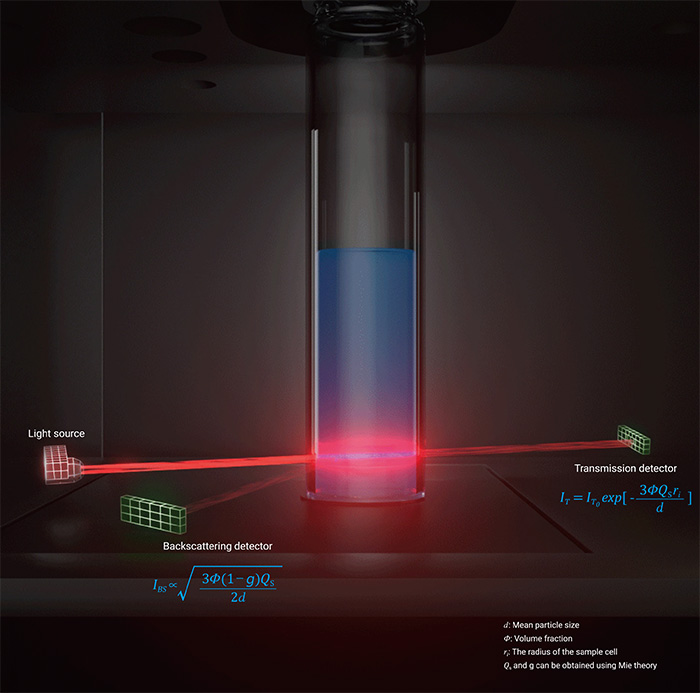
Advanced Measurement PrincipleStatic Multiple Light Scattering (SMLS) is employed to characterize the stability of dispersions. Within BeScan Lab, a setup comprising two detectors and an LED light source ascends along the sample cell to conduct sample scanning. In the case of concentrated samples, the backward detector is employed to detect backscattered signals, while for diluted samples, the forward detector is utilized to detect transmitted signals.
Versatile Applications
- Agrochemicals
Evaluate the stability of pesticide formulations to predict shelf life and ensure the consistent performance of suspension systems.
- Battery and Energy
Test the stability of electrode materials and electrolytes, crucial for enhancing battery performance and lifespan.
- Ceramics
Analyze the stability of ceramic slurries and monitor the stability of glazes and pigments, ensuring reliable production processes.
- Home and Personal Care
Ensure product stability in cosmetics, lotions, creams, and other formulations for reliable performance.
- Food and Beverage
Test the stability of food products, from milk to sauces, and assess the dispersibility of food powders to maintain product quality.
- Petrochemicals
Monitor and ensure the stability of oil products, providing critical insights into the long-term performance of lubricants and the behavior of polymers in oil.
- Pharmaceuticals
Conduct stability testing for medicinal formulations, assess long-term drug stability, and analyze biomacromolecule aggregation to ensure product efficacy.
- Paints, Coatings and Inks
Measure the stability of coatings and inks, and evaluate the dispersion of pigments and dyes for uniform product quality.
-
Technology
Static Multiple Light Scattering
Static Multiple Light Scattering (SMLS) is an optical technique used to directly characterize native concentrated liquid dispersions. This technique emits light into the sample, where it is scattered multiple times by particles or droplets before being detected.
BeScan Lab applies SMLS using an 850 nm LED as light source, with detectors set at 0° for capturing transmitted light and at 135° for backscattered light. This setup scans the sample vertically, analyzing the transmitted light for transparent systems, while the backscattered light is ideal for opaque systems.
The signals are collected at 20 μm intervals, which enables precise observation of changes in size (d) and concentration (Φ) of suspended materials.
Signal display
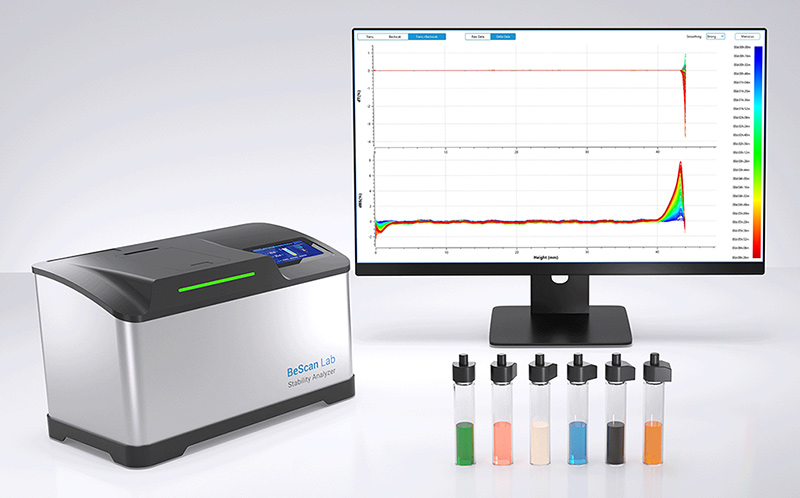
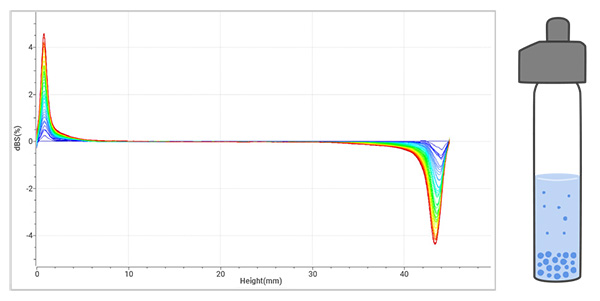
Customized scanning procedures allow presentation of scans with different colors corresponding to different scanning times. The overlap of scans demonstrates how signals diverge from the reference as they vary with height and time. Intuitively, the scans capture local changes that characterize unstable phenomena.
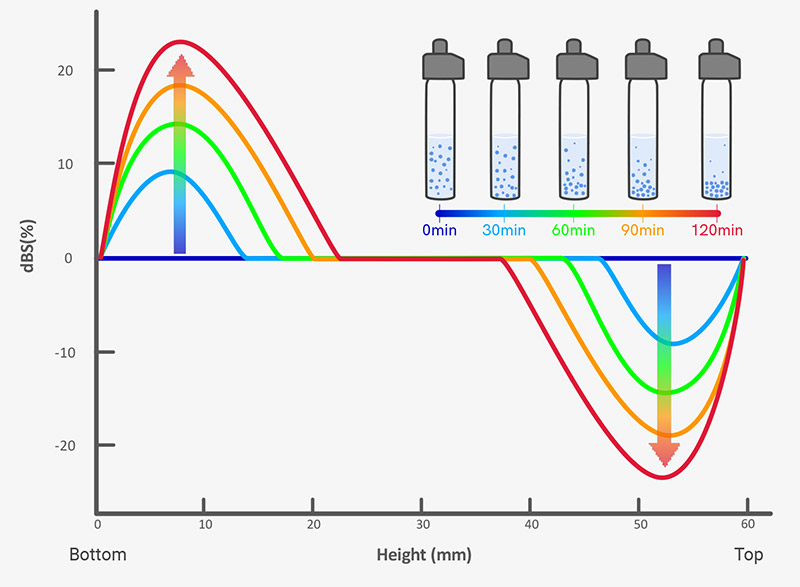
The example illustrates that during sedimentation, the backscattered signals (dBS) undergo a distinctive pattern of change: a decrease at the top and an increase at the bottom, which is attributed to the migration of particles.Features
- Versatile measurement
No limitations on color or viscosity, and suitable for a wide range of samples from low to high concentrations (up to 95% v/v).
- Non-destructive and in situ
Measures without preparation, thus preserving the sample’s original characteristics.
- Wide particle size range
Capable of measuring particles from 0.01 to 1,000 μm.
- Applicable to various systems
Suitable for emulsions, suspensions, foams, and other dispersions, providing robust and high-resolution measurements.
-
Software
Dedicated Software
for Superior Qualitative and Quantitative Stability Outcomes
Qualitative Analysis – Identification of Destabilisation
BeScan Lab utilises near-infrared light and a precise 20-micrometer spatial resolution to detect early-stage destabilisation phenomena like phase separation, sedimentation, creaming and aggregation (flocculation, coalescence, and coagulation) well before they are visually observable.
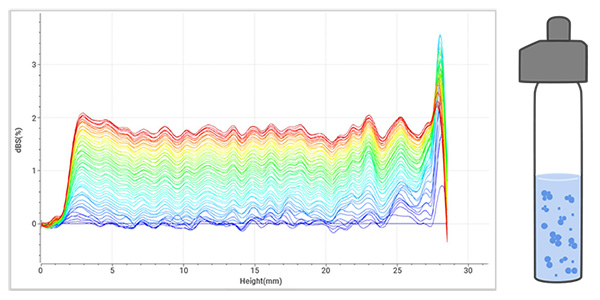
1. Flocculation often results in uniform changes in transmitted or backscattered signals across the entire sample height.
- Common in wastewater treatment, electrode slurries, and drilling fluids.
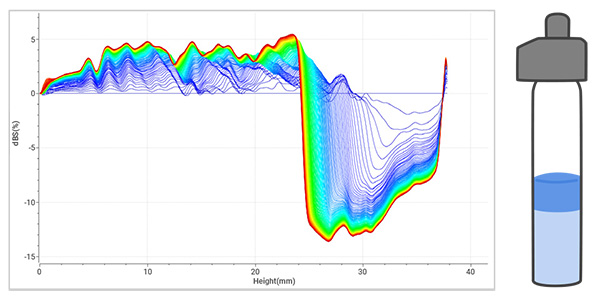
2. Phase separation typically involves evolving interfaces between phases over time.
- Common in paints and coatings, cosmetics.
3. Sedimentation causes a decrease in backscattered signals at the top and an increase at the bottom in opaque samples.
- Common in slurries, pigments, pesticides, vaccines, and body lotions.
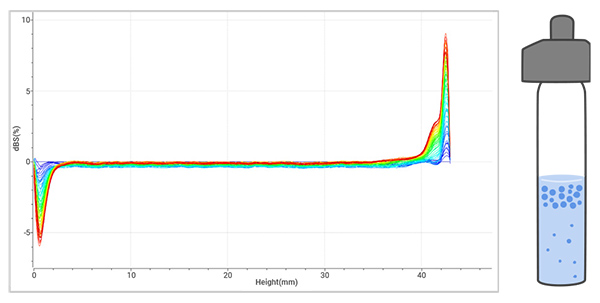
4. Creaming in opaque samples enhances backscattered signals while lowering bottom signals.
- Common in milk-based beverages, lipid emulsions, and pesticides.
Quantitative Analysis – Instability Index for Rating Guide
BeScan Lab provides the instability index (IUS), which quantifies the stability of dispersions. The calculation involves summing all signal variations across the entire sample height and over time, capturing all subtle variations within the sample. This facilitates sample comparison, as a greater instability index (IUS) indicates lower stability. An instability index is automatically calculated after every scan using the following formula:

BeScan Lab offers instability indices over time to compare the stability of different samples. A slower increase in the instability index indicates higher dispersion stability, resulting in a flatter curve. Analysing the trend allows for predicting long-term stability.
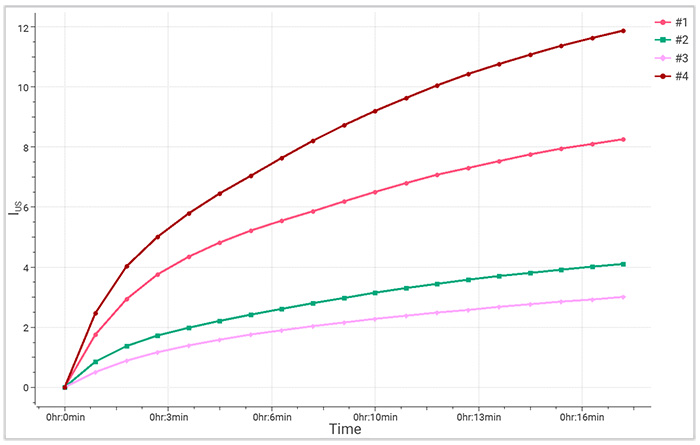
Time-dependent instability index
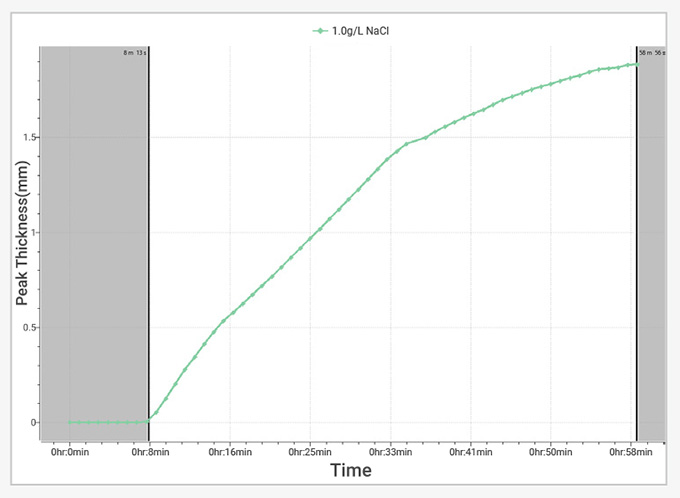
1. Phase separation dynamics and mean particle size
Hydrodynamic analysis reveals layer thickness and particle migration rate over time, thereby determining the hydrodynamic mean diameter.
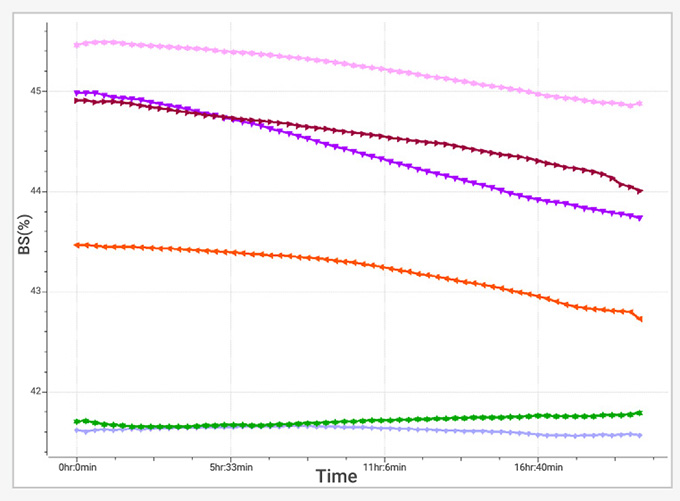
2. Optical analysis and mean particle size variation
Particle size variation analysis is achievable with BeScan Lab, correlating transmitted and backscattered light signals.
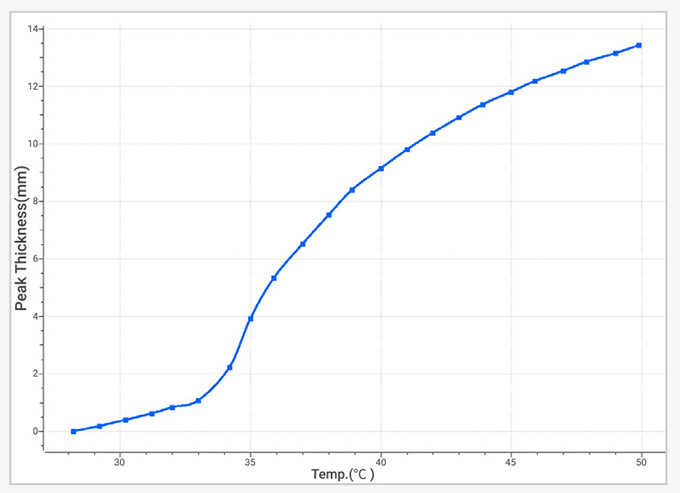
3. Temperature trend measurement
Programmable temperature trend measurement up to 80°C, which explores stability under extreme conditions and accelerates destabilisation.
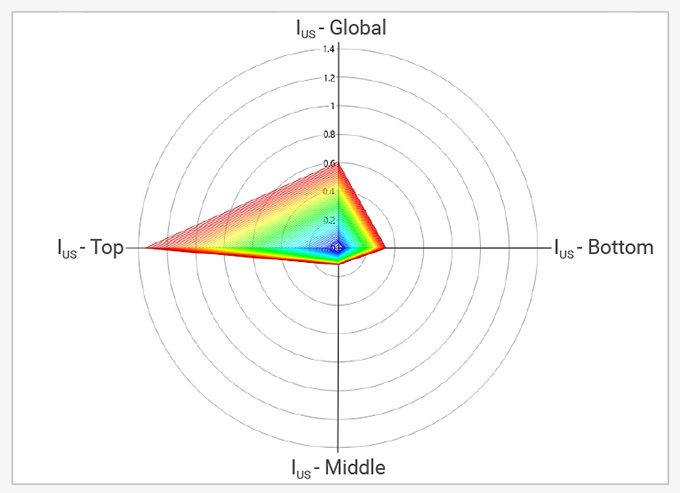
4. Radar chart
Global and regional instability indices for each scanning are illustrated in form of a radar chart, intuitively providing a way to investigate regional stability (top, middle, and bottom).
-
Specification
Parameters Values Measurement principle SMLS (Static Multiple Light Scattering) Detection angle 0° transmission and 135° backscattering Light source 850 nm LED Scan step 20 μm Scan height 0 – 60 mm Number of samples 1 Maximum volume fraction* 95% Measurement range of particle size 0.01 – 1000 μm Temperature range RT – 80 ℃ (±0.5 ℃ ) Sample volume 4 – 25 mL Measurement mode Regular/Fixed point/Temp. trend Dimension 460(L) x 260(W) x 280(H) mm Weight 13.5 kg Power AC100 – 240 V, 50 – 60 Hz, 3.8 A ISO compliance ISO/TR 18811:2018, ISO/TR 13097:2013
ISO/TR 21357:2022, ISO/TS 22107:2021
* Sample and sample preparation dependent
-
Applications
Not sure if it’s the right instrument?
No worries, send us a sample and we will test it for you
-
Name of customer
Morbi ornare magna nec tortor rutrum interdum. Donec interdum facilisis elit, et iaculis nunc facilisis vitae. Sed quis semper dolor, id efficitur ex. -
Name of customer
Morbi ornare magna nec tortor rutrum interdum. Donec interdum facilisis elit, et iaculis nunc facilisis vitae. Sed quis semper dolor, id efficitur ex. -
Name of customer
Morbi ornare magna nec tortor rutrum interdum. Donec interdum facilisis elit, et iaculis nunc facilisis vitae. Sed quis semper dolor, id efficitur ex. -
Name of customer
Morbi ornare magna nec tortor rutrum interdum. Donec interdum facilisis elit, et iaculis nunc facilisis vitae. Sed quis semper dolor, id efficitur ex. -
Name of customer
Morbi ornare magna nec tortor rutrum interdum. Donec interdum facilisis elit, et iaculis nunc facilisis vitae. Sed quis semper dolor, id efficitur ex. -
Name of customer
Morbi ornare magna nec tortor rutrum interdum. Donec interdum facilisis elit, et iaculis nunc facilisis vitae. Sed quis semper dolor, id efficitur ex. -
Name of customer
Morbi ornare magna nec tortor rutrum interdum. Donec interdum facilisis elit, et iaculis nunc facilisis vitae. Sed quis semper dolor, id efficitur ex.
