Customise Consent Preferences

We use cookies to help you navigate efficiently and perform certain functions. You will find detailed information about all cookies under each consent category below.

The cookies that are categorized as "Necessary" are stored on your browser as they are essential for enabling the basic functionalities of the site. ... 

Always Active

Necessary cookies are required to enable the basic features of this site, such as providing secure log-in or adjusting your consent preferences. These cookies do not store any personally identifiable data.

No cookies to display.

Functional cookies help perform certain functionalities like sharing the content of the website on social media platforms, collecting feedback, and other third-party features.

No cookies to display.

Analytical cookies are used to understand how visitors interact with the website. These cookies help provide information on metrics such as the number of visitors, bounce rate, traffic source, etc.

No cookies to display.

Performance cookies are used to understand and analyze the key performance indexes of the website which helps in delivering a better user experience for the visitors.

No cookies to display.

Advertisement cookies are used to provide visitors with customized advertisements based on the pages you visited previously and to analyze the effectiveness of the ad campaigns.

No cookies to display.

Biological
Applications
Serum

Applications Measuring nanoparticles in blood serum

Spectradyne’s technology allows the measurement of nanoparticles in serum!

Overview

The Spectradyne nCS2TM and ARCTM particle size analyzers can be used to analyze nanoparticles in blood serum, blood plasma, as well as in other weakly conducting analytes such as PBS or other salt-containing solutions.

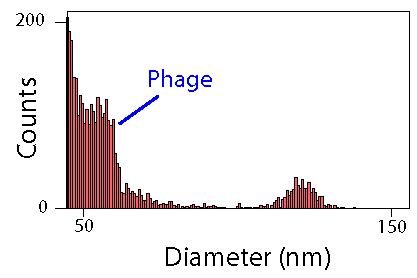
Below we display data showing the positive detection of bacteriophage in murine blood plasma. Left plot shows the raw particle detection data, of T7 phage in murine plasma. Center plot shows the histogram of effective particle diameters, showing a peak in particle concentration at 55 nm attributed to the bacteriophage. Left plot shows the concentration spectral density (CSD) of the blank plasma (blue dashed), phage-infected plasma (green dot-dashed) and the difference (red solid). These data also yield a 55 nm diameter for the phage. Integration of the peak gives the measured phage concentration of 5.3 × 10¹⁰ particles per ml, near that obtained by biological titre, of 1.5 × 10¹⁰ pfu/ml).

BioLector Microbioreactor BioLector Microbioreactor BioLector Microbioreactor