Introduction
Geometry can play a crucial role in the performance of fibres in
different applications. Shape factors that influence performance
include length (i.e. size of the longest dimension of the fibre), width
(i.e. size of the shortest dimension), and curl. Despite the importance
of fibre geometry, many conventional particle sizing measurements
struggle to accurately capture the morphology of these particles.
Volumetric-based particle sizing methods such as laser diffraction
and Coulter Counters assume particles exhibit spherical geometry
and only report equivalent spherical diameter (ESD) measurements.
Manual microscopy, the primary method used for measuring fibre
length and width, is low-throughput and labour-intensive to perform.
Flow imaging microscopy (FIM) instruments like FlowCam are an
automated, high-throughput alternative to manual microscopy for
fibre analysis. VisualSpreadsheet® software acquires and analyses
images of fibrils, providing automated measurements of not only
fibre length and width but also fibre straightness and curl from
particle images similar to those obtained via manual microscopy
(Figure 1). As FIM instruments capture fibre images in a flowing
fluid, this technique offers much higher throughput than manual
microscopy. These features make FlowCam an ideal instrument for
rapid, automatic fibre analysis.
Fibre measurements in VisualSpreadsheet
Most particle imaging systems use Feret measurements to determine
the length and width of particles. Feret measurements involve finding
edges on opposite sides of a particle that are parallel to each other
and measuring the distance between these edges. The shortest
Feret measurement is reported as particle width, and the longest
is reported as particle length (Figure 2). These Feret measurements
are recorded as the “Length” and “Width” parameters reported
by VisualSpreadsheet. While these measurements are accurate for
symmetric and straight particles, Feret measurements dramatically
undersize the length and oversize the width of curved particles.
VisualSpreadsheet also records Geodesic measurements of particle
lengths and widths. Geodesic measurements account for the arcing
of particles like fibres, thus providing a more accurate representation
of fibre length and width (Figure 2). In VisualSpreadsheet, these fibre
measurements are reported as geodesic length and geodesic thickness.
Figure 3 shows a comparison between these measurements for a
straight fibre and for a curved fibre. Reported values for length (Feret)
and geodesic length of the straight fibre are relatively similar, as are
those for width (Feret) and geodesic thickness. When these values
are compared for the curved fibre, the length (Feret) measurement
is much lower than the geodesic length measurement, and width is a
much larger value than the geodesic thickness measurement. While
the length (Feret) measures the long-axis distance covered by the
particle, the geodesic length factors the curvature of the particle into
its reported length and is thus more accurate. Similarly, the geodesic
thickness is more accurate as it primarily accounts for the width of the
particle and not the short-axis distance covered by the particle.
Other fibre measurements available in VisualSpreadsheet include
fiber straightness and fibre curl. Fiber straightness is the ratio
of length (Feret) to geodesic length. Higher straightness values
indicate better agreement between the Feret and geodesic length
measurements, corresponding to straighter particle geometry.
Fiber curl is calculated by dividing geodesic length by length (Feret)
and subtracting one. A particle with a fibre curl of zero is perfectly
straight and increasing curl values indicating higher degrees of
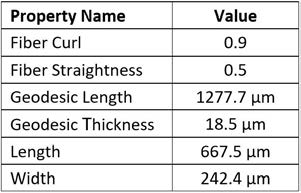
curling. Figure 4 shows fibre measurement data for a curved wood
fibre with a relatively high fibre curl value and relatively low fibre
straightness value.
Using fibre measurements to evaluate samples
In applications where fibre morphology is important for quality
control of fibrous materials, VisualSpreadsheet can be used to
build and save custom filters that automatically report counts and
concentrations of particles matching a particular specification. For
example, if fibre straightness is of concern, pre-built filters can
automatically report a percent of fibres that meet or exceed a user defined
fibre straightness threshold.
Figure 5 shows data for custom value filters created for bleached
softwood cellulose microfibrils at a specific stage of the refining
process. For this example, at least 50% of the fibres must have fibre
straightness ≥ 0.75 for a lot to pass quality control. After each lot of
fibres is analysed, the filter bins instantly populate with a percentage
of particles matching the passing criteria, allowing operators to
quickly assess whether a particular lot has passed.
An added benefit of VisualSpreadsheet is the ability to directly
interact with the filter grid and data plots. By selecting the “Pass –
Fibre Straightness 0.75+” filter, particle images that match the filter
will automatically display in the View Window (Figure 6, next page).
These particle images can then be sorted, selected, and/or saved.
Regions of histograms or scatterplots that contain particles matching
the filter will also be highlighted. Data can be easily exported into
Excel or as a PDF document for a seamless reporting and archiving
process.
Conclusion
FlowCam is a powerful analytical tool that expedites and streamlines
fibre analysis. Integrated fibre morphology parameters include
geodesic length, geodesic thickness, fibre straightness, and fiber curl.
Using these measurements, FlowCam provides more accurate and
reliable data than volumetric-based methods and offers a significant
time-savings over manual microscopy. The option of building custom
filters in VisualSpreadsheet allows for instantaneous reporting of
results at the conclusion of sample analysis, saving users time and
effort in assessing fiber quality.

