We use cookies to enhance your browsing experience and analyse our traffic. By clicking "Accept All", you consent to our use of cookies.
Customise Consent Preferences
We use cookies to help you navigate efficiently and perform certain functions. You will find detailed information about all cookies under each consent category below.
The cookies that are categorized as "Necessary" are stored on your browser as they are essential for enabling the basic functionalities of the site. ...
Always Active
Necessary cookies are required to enable the basic features of this site, such as providing secure log-in or adjusting your consent preferences. These cookies do not store any personally identifiable data.
No cookies to display.
Functional cookies help perform certain functionalities like sharing the content of the website on social media platforms, collecting feedback, and other third-party features.
No cookies to display.
Analytical cookies are used to understand how visitors interact with the website. These cookies help provide information on metrics such as the number of visitors, bounce rate, traffic source, etc.
No cookies to display.
Performance cookies are used to understand and analyze the key performance indexes of the website which helps in delivering a better user experience for the visitors.
No cookies to display.
Advertisement cookies are used to provide visitors with customized advertisements based on the pages you visited previously and to analyze the effectiveness of the ad campaigns.
The British Zeolite Association promotes zeolite and ordered nanoporous materials science in the UK.
About the British Zeolite Association (BZA)
The British Zeolite Association was founded in 1977 to provide a forum where zeolite scientists could meet to review and share their latest findings. Today, the (ordered) nanoporous materials community in the UK numbers several hundred active research scientists and engineers, from both industry and the academic sector, who reflect the great variety of applications of micro- and mesoporous materials, from catalysis and petrochemical processing to chemical separations, detergents, and environmental clean-up.
Registration
from £225.00
BZA membership 2025-26
Buffet lunch (29th and 30th)
Conference evening reception and refreshments at the poster session (28th)
Conference dinner (29th)
You will be required to provide some personal details for registration on the ‘Checkout’ page. We only store this information for the purpose of organising the BZA Annual Meeting.
*Other eligible members are those who are not currently in full-time employment with a university or company.
Understanding the Coulter Principle: The Science Behind the Beckman Coulter Multisizer 4e
Introduction
Particle size analysis is a critical aspect of numerous scientific and industrial applications, from pharmaceutical development to food processing and materials science. One of the most widely used and precise methods for particle characterisation is the Coulter Principle, which forms the foundation of the Beckman Coulter Multisizer 4e. This advanced instrument has revolutionised the way researchers and manufacturers measure particle size and concentration, offering high resolution and accuracy across a wide range of applications.
The Coulter Principle Explained
The Coulter Principle, also known as the Electrical Sensing Zone (ESZ) method, was developed by Wallace H. Coulter in the 1950s. This principle states that when particles suspended in an electrolyte solution pass through a small aperture between two electrodes, they cause a temporary change in electrical resistance proportional to their volume. Each particle displaces a specific amount of electrolyte, generating an electrical pulse that is directly correlated to the particle’s size.
The Coulter Principle offers several advantages over optical and laser-based methods, including:
High accuracy: Direct measurement of volume ensures precise sizing.
Wide dynamic range: Capable of detecting particles from sub-micron to hundreds of microns.
Independent of particle refractive index: Unlike laser diffraction, the method does not rely on light scattering, making it ideal for opaque or irregularly shaped particles.
Absolute counting: Unlike ensemble methods, the Coulter Principle enables individual particle counting and size distribution analysis.
The Beckman Coulter Multisizer 4e: Advancing Particle Analysis
The Beckman Coulter Multisizer 4e is a state-of-the-art instrument that utilizes the Coulter Principle to provide high-resolution particle size distribution analysis with unparalleled precision. It is widely used in industries such as pharmaceuticals, biotechnology, food and beverage, and materials science.
Key Features and Advantages
Broad Measurement Range: The Multisizer 4e can measure particles ranging from 0.2 to 1,600 microns, making it suitable for diverse sample types.
High Resolution and Accuracy: The ability to measure individual particles provides detailed distribution profiles, allowing detection of subtle differences in particle populations.
Advanced Aperture Technology: The system utilizes multiple aperture sizes to optimise analysis for specific sample types.
Robust Data Analysis and Reporting: Integrated software offers detailed statistical analysis, real-time monitoring, and customisable reporting for enhanced usability.
Versatility Across Industries: The instrument is widely used for applications such as blood cell analysis, battery materials research, protein aggregation studies, and more.
Applications of the Multisizer 4e
The versatility of the Multisizer 4e makes it a valuable tool across multiple disciplines:
Pharmaceuticals: Ensures uniformity in drug formulations and stability of suspensions.
Biotechnology: Used for analysing cell size distributions and monitoring cell cultures.
Batteries and Materials Science: Evaluates particle distribution in battery electrodes for optimal performance.
Food and Beverage: Determines particle size in emulsions and powders to ensure product consistency.
Cosmetics: Assesses particle size in creams and lotions for texture and stability control.
Conclusion
The Coulter Principle remains one of the most reliable and precise methods for particle size analysis, and the Beckman Coulter Multisizer 4e exemplifies its power and versatility. By offering high-resolution data, absolute particle counting, and broad application potential, the Multisizer 4e is an essential tool for researchers and industry professionals seeking accurate and reproducible particle characterisation.
Whether in pharmaceuticals, biotechnology, or materials science, the Coulter Principle continues to drive advancements in particle analysis, helping scientists and engineers develop better products and technologies for the future.
FlavourTalk Raw Materials Exhibition on Wednesday 26th and Thursday 27th March 2025 in London providing delegates with a unique opportunity to meet 46 suppliers of flavour raw materials from companies in Europe and beyond.
FlavourTalk 2025 will be held at the Millennium Gloucester Hotel Conference Centre.
Information to support the Flavourings Industry
Who should attend?
All those involved with the formulation and creation of flavours and seasonings.
Flavourists, flavour technologists, regulatory experts, marketing and sales personnel, buyers and all those interested in future trends in the supply of flavour raw materials and technological developments.
Technologists and marketeers in food manufacturing companies who wanted to understand what new flavouring ingredients were available for innovative new products.
26-27 March 2025
Millennium Gloucester Hotel & Conference Centre, London
The Advanced Materials Show is a showcase of materials with exceptional properties for engineering and electronic applications, along with the technologies used to develop them.
The event brings together leaders in R&D, engineering, science and innovation to share knowledge and learn how to improve advanced materials with particular focus on properties such as: Lightweighting, Conductivity, Durability, Thermal Resilience and Strength.
Co-located with The Advanced Ceramics Show, Battery Cells & Systems Expo and Vehicle Electrification Expo, the four shows will welcome 300+ exhibitors and 4,000+ visitors in July 2025.
9th – 10th July 2025
NEC, Birmingham, UK
The UK’s leading advanced technology and innovation show returns to the NEC in 2025.
The Advanced Materials Show is an international showcase of the latest innovations in modern materials. The leading exhibition and conference will bring together materials engineers, R&D professionals, scientists and product developers involved in manufacturing and integrating advanced materials technology.
Spread over two days, 9th & 10th July 2025, The Advanced Materials Show will offer an unrivalled insight into current and future industry trends and challenges.
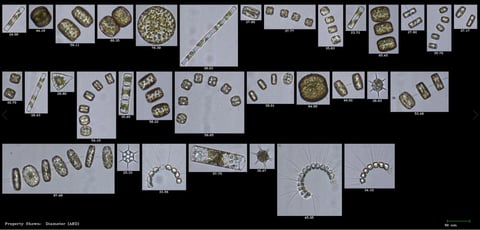
Flow Imaging Microscopyis a fast and automated method to see highly-resolved digital images of microscopic particles in a flowing liquid.
Using FlowCam, you can very quickly learn about the size, count, shape, and identity of the particles in your sample.
Flow Imaging Microscopy began as a novel concept when the first flow imaging microscope—FlowCam—was developed at Bigelow Laboratory for Ocean Sciences in Boothbay Harbour, Maine. The then-available tools, a microscope for plankton identification and a flow cytometer for counting, were time-consuming and labour-intensive, so the scientists at Bigelow sought to develop a better method.
Their FlowCamdesign combined the benefits of a flow cytometer and a microscope in a single instrument. A sample of ocean water could be introduced into the system, and particles would be automatically, digitally imaged and analysed.
Today, FlowCam is an essential tool inparticle characterisationlabs in a broad array of biologics and materials applications that care about the size, shape, and morphology of particles in solution:
Aquatic: the study of microbial life in the world’s marine and freshwater bodies to understand key processes driving these ecosystems
Biopharma: characterization of biopharmaceutical aggregates and other subvisible particles in parenteral drugs to evaluate the stability of formulations
Cell and gene therapy:analysis of cells, aggregates of drug carriers, and drug delivery vehicles
Food and beverage:quality control of food ingredients where particle shape can affect taste and texture
Materials:formulation development, process troubleshooting, and QA/QC testing for microspheres, emulsions, encapsulated materials, fibres, and polymers.
How Does Flow Imaging Particle Analysis Work?
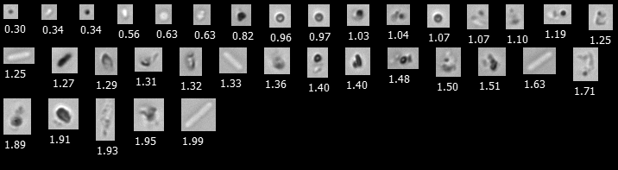
The flow imaging particle analysis workflow is streamlined withFlowCam! A sample containing particles is injected into a flow cell, where it flows through a path positioned between a light source and a magnifying objective in front of a digital camera. As the sample passes by, the camera automatically captures images of up to 50,000 particles per minute.
In real-time, VisualSpreadsheet software extracts single particle images from the camera images. It compiles a variety of basic measurements such as particle count, diameter, volume, and aspect ratio, as well as more advanced morphology measurements like circularity, elongation, and perimeter. Other particle characteristics include intensity, transparency, and colour. Using VisualSpreadsheet, you can readily sort, filter, classify, and display your data analysis in various formats.
Direct Particle Measurements
One of the key advantages of flow imaging microscopy with FlowCam is that particle measurements are calculated directly from an image of the particle. Since flow imaging microscopy is designed with fixed optics at known magnifications, distance measurements on the image can be directly converted to real distance measurements on the object. Flow imaging systems do not have to make any assumptions about a particle’s size and shape because they measure multiple particle properties directly from an image.
Other particle analysis systems, such as light obscuration, laser diffraction, and light scattering, need to make assumptions about the particle’s physical dimensions. These techniques measure a signal proportional to a physical dimension and convert that signal to a value representing the number of particles and corresponding particle size distribution in the sample. In addition, many of these analytical techniques only measure ensemble (bulk) properties, i.e., the properties of the overall population distribution.
The ultimate benefit of performing flow imaging microscopy with a FlowCam imaging system is that you can visualize single particles and calculate desired sample properties based directly on individual particle images.
Surface plasmon resonance (SPR) is an optical, surface-sensitive technique used to study the label-free interaction of biomolecules in a complex environment in real-time. In a typical SPR experiment, ligands are immobilised on a SPR sensor surface which is exposed to a flowing solution of analytes in a microfluidic channel. The sensor surface is generally a glass prism covered with a thin metal layer, like gold or silver. A plane-polarized, monochromatic incident light is directed onto the sensor to which the ligands are attached, creating charged oscillations, called surface plasmons, at the metal surface. When analytes become bound to surface-immobilised ligands, the surface plasmon resonance conditions change, resulting in a change in the reflected angle or wavelength of the light, depending on the interrogation used. This change is captured and plotted vs. time to generate a sensorgram.
Sensograms
Sensorgrams are used to extract affinity and kinetic data of the interactions between the ligand and analyte. They can also reveal any specificity and concentration information through the magnitude of the SPR signal. In general, a sensorgram has five phases:
Baseline: The initial phase is the baseline. A running or flow buffer is used to condition the sensor surface and check for any sensor system instability.
Association: The second phase is where analytes begin to bind to immobilized ligands. It is indicated by the initial sharp rise of the SPR signal in the sensorgram and it is ideally a single exponential curve.
Steady state: This phase occurs at the top flat portion of the sensorgram where the net rate of bound analytes is zero.
Dissociation: This phase begins when the analyte solution is replaced by a wash buffer, which causes the specific interactions between the analytes and ligands to break
Regeneration: Finally, a low pH buffer such as glycine is flowed to reset the SPR baseline signal as the beginning of the experiment
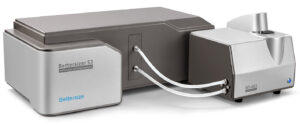
Reliability you can count on: 3-Year Warranty from Bettersizer
We provide a 3-year warranty on our instruments, ensuring peace of mind and dependable performance. Included with this, we offer complimentary software upgrade assistance within the instrument’s life cycle.
The 3-year extended warranty from Bettersize Instruments provides several key benefits:
Cost Savings & Predictability
Extending the warranty reduces the risk of unexpected repair costs.
It helps with budgeting by covering potential call-outs and parts replacement expenses.
Minimised Downtime
Fast and professional technical support ensures quick issue resolution.
Keeps instruments running smoothly, avoiding disruptions in sample analysis.
Long-Term Performance & Reliability
Regular maintenance and genuine replacement parts extend the lifespan of the instrument.
Ensures continued accuracy and precision in particle size analysis.
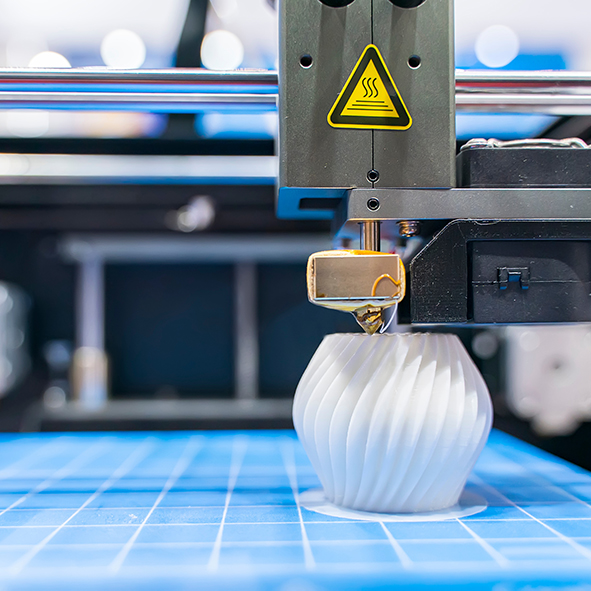
Bettersizer S3+ aids Additive Manufacturing processes
What does the Bettersizer S3+ offer?
The Bettersize Instruments Bettersizer S3+ plays a crucial role in Additive Manufacturing (AM) by providing precise particle size and shape analysis of metal, polymer, and ceramic powders. AM processes, such as Selective Laser Sintering (SLS), Electron Beam Melting (EBM), and Binder Jetting, rely on powders with well-defined particle size distributions (PSD) and morphology to ensure consistent layer deposition, packing density, and flowability.
Importance of using the right technology
The Bettersizer S3+ integrates laser diffraction and dynamic image analysis, enabling high-resolution measurement of particle size (0.01–3500 µm) and direct visualisation of shape characteristics. The laser diffraction technique provides a rapid and accurate PSD analysis, which is essential for optimizing powder bed density and minimising defects like porosity or poor fusion. The dynamic image analysis detects particle sphericity, aspect ratio, and agglomeration, which influence powder flow and print quality.
By ensuring tight control over powder quality, the Bettersizer S3+ helps manufacturers optimise material performance, mechanical properties, and process efficiency. Real-time data enables rapid adjustments in powder selection, recycling strategies, and supplier quality control, reducing costs and improving final part integrity. This makes the Bettersizer S3+ an essential tool for ensuring repeatability and reliability in industrial AM applications.
Christmas Material Characterisation: Analysing Chocolate with Meritics
Indulging in chocolate has become a festive staple, from advent calendars and selection boxes to bracing mugs of hot chocolate. There is a measure of subjectivity to our enjoyment of chocolate-based products, but there are numerous neurocognitive benefits of chocolate-consumption that go beyond personal perception. Material characterisation of the chemical relationship between chocolate and neurocognitive activity has shown that chocolate-consumption stimulates the neurotransmitters phenylethylamine and serotonin. The former often causes a sense of alertness or excitement while the latter is commonly referred to as the happiness hormone. This is the primary chemical explanation for why chocolate and cocoa-based products have developed such a wholesome reputation.
In truth, quantitatively demonstrating the enjoyment of chocolate through material characterisation is barely necessary. Humankind has been consuming it in one form or another since 1900 B.C.E. and it is currently a $50 billion-a-year worldwide industry. The festive season is an enormous factor in this booming success.
Limited edition chocolate bars, novel hot chocolate mixtures, and entirely new recipes are often launched on the market in the build-up to Christmas. Each of these new products must be subjected to material characterisation to ensure that batches are compliant with regulations, and to determine thermodynamic stability under varying conditions. Even the nation’s favourite chocolates must undergo routine material characterisation during quality control (QC), particularly when product output reaches its highest volumes.
Material Characterisation of Chocolate: Viscosity & Particle Size
Viscosity is a critical characteristic at several stages of chocolate production. In the first instance, it is important for monitoring the consistency of the liquor that is refined from cocoa bean nibs. Grinding mechanisms are used to reduce the pulpy cocoa mass into a smooth liquid phase that is subsequently mixed and blended with cocoa butter and sugar. The flow characteristics of this raw material may be indicative of its performance during moulding, and the texture of the end-product.
Particle size is also a key factor in the texture and flavour of chocolate products. The size of particles in chocolate pastes and the particle size distribution (PSD) of mixed cocoa and milk recipes are indicative of the consistency of the final product.
Manufacturers may also measure the viscosity of blended mixtures to assess the formability and mouldability of specific chocolate recipes. Higher chocolate viscosities are desirable for moulding shapes and coating products with a thick and rich shell. Lower chocolate viscosities, by comparison, are used for more delicate coatings and liquid chocolate applications. It is unfeasible to use a chocolate of low viscosity in a chocolate fountain, for example. These two types can be mixed into a compound recipe, but this may impact flavour and texture.
Rheological material characterisation is often performed to determine both the applications and shelf-life conditions of limited edition chocolates or newly released products. Chocolates formed into the shape of Santa Claus, for example, are likely to have been subjected to viscosity measurements to ensure the end-product can hold its iconic shape. Particle size analysis is used in conjunction with such measurements to ensure that the properly-formed product has an appropriate taste and texture.
Christmas Materials Characterisation with Meritics
Meritics supplies an extensive range of analytical instruments for R&D and QC applications in the food and beverage industry. We have already demonstrated the unique potential for chocolate viscosity measurements using the RM200 Plus rheometer and have introduced chocolate materials characterisation capabilities with the LS 13 320 XR. This industry-leading particle size analyser can qualitatively assess the ‘mouth feel’ of chocolate products and eliminate particles that would contribute towards a gritty, unpleasant texture.
If you have any more questions, please do not hesitate to contact us directly. Otherwise, have a very merry Christmas and check back with us in the New Year for more posts about innovative material characterisation.
Comparing FlowCam Results with Light Obscuration: A Study by Japan’s National Institute of Health Sciences
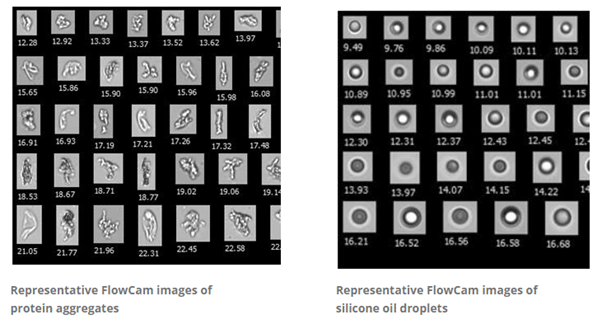
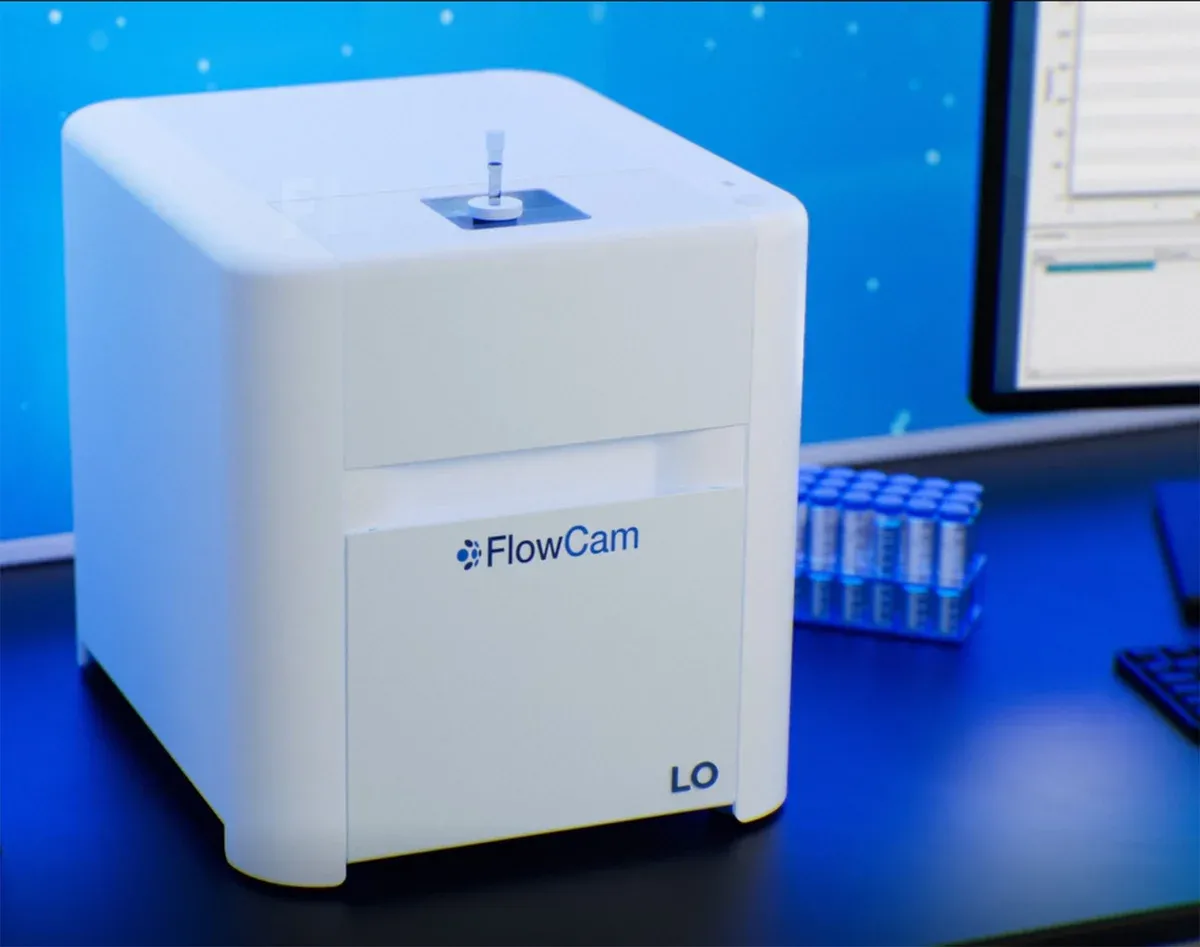
In their recent publication, Quantitative Evaluation of Insoluble Particulate Matters in Therapeutic Protein Injections Using Light Obscuration and Flow Imaging Methods, Shibata et. al. compare the ability of Light Obscuration and Flow Imaging to detect and accurately characterize subvisible particles in injectable drugs.
The team at Japan’s National Institute of Health Sciences write the following:
Flow imaging (FI) has emerged as a powerful tool to evaluate insoluble particles derived from protein aggregates as an orthogonal method to light obscuration (LO). However, few reports directly compare the FI and LO method in the size and number of protein particles in commercially available therapeutic protein injections. In this study, we measured the number of insoluble particles in several therapeutic protein injections using both FI and LO, and characterized these particles to compare the analytical performance of the methods. The particle counts measured using FI were much higher than those measured using LO, and the difference depended on the products or features of particles. Some products contained a large number of transparent and elongated particles, which could escape detection using LO. Our results also suggested that the LO method underestimates the size and number of silicone oil droplets in prefilled syringe products compared to the FI method. The count of particles ≥10mm in size in one product measured using FI exceeded the criteria (6000 counts per container) defined in the compendial particulate matter test using the LO method. Thus precaution should be taken when setting the acceptance criteria of specification tests using the FI method.
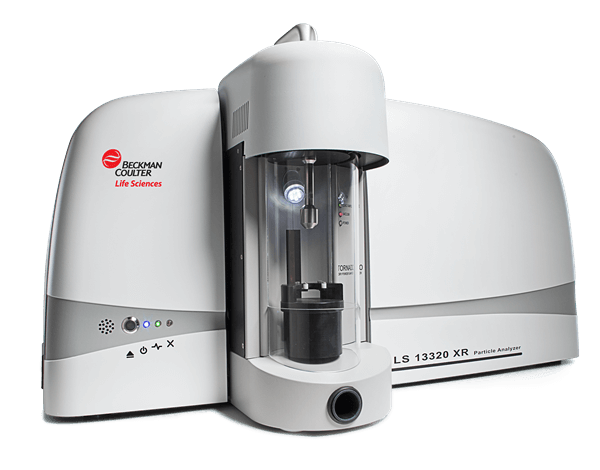
One versatile instrument for this purpose is the Beckman Coulter LS13320XR, which utilises laser diffraction for accurate particle size measurement.
This advanced system accommodates both wet and dry analysis, making it ideal for a broad range of applications.
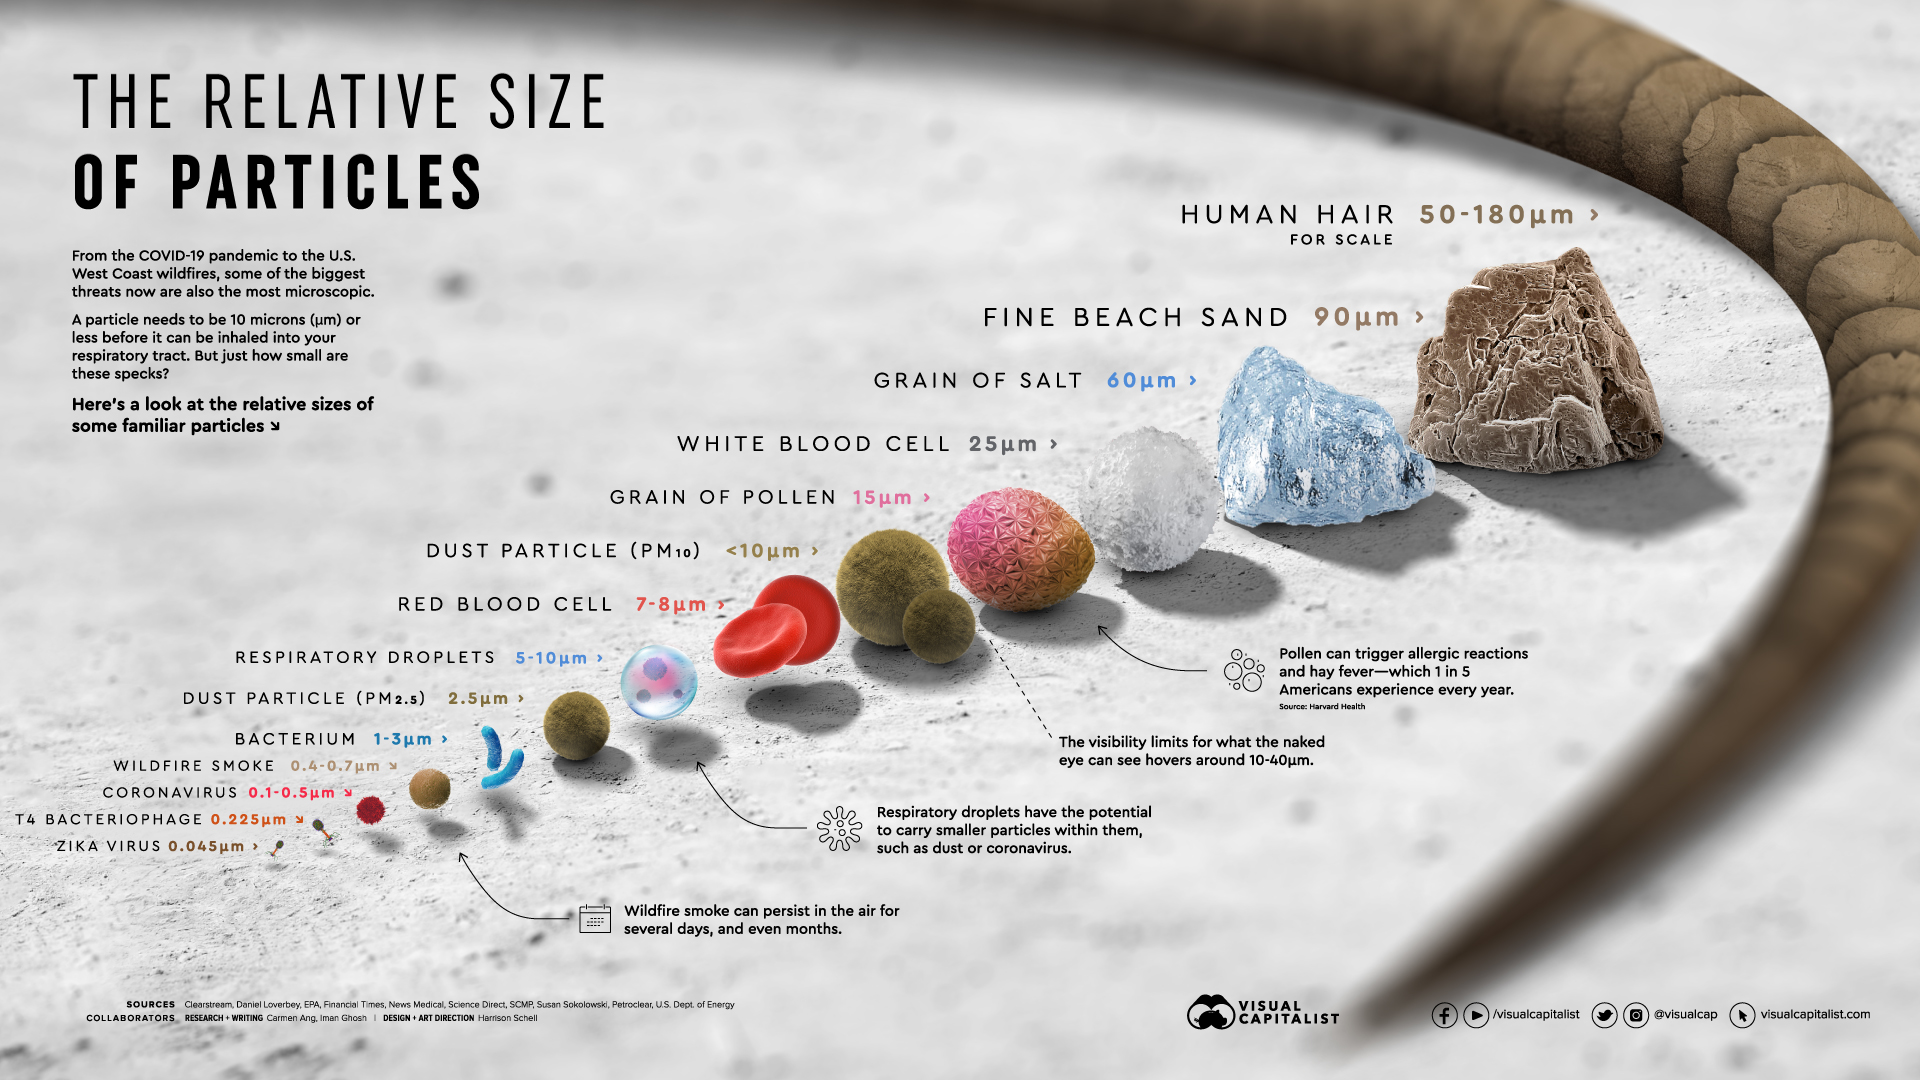
This image gives you an idea of the size of many particles we are familiar with in day to day life.
The LS13320XR has the capability to measure particles from 10 nm – 3,500 µm making it a really versatile instrument for analysing almost any particle.
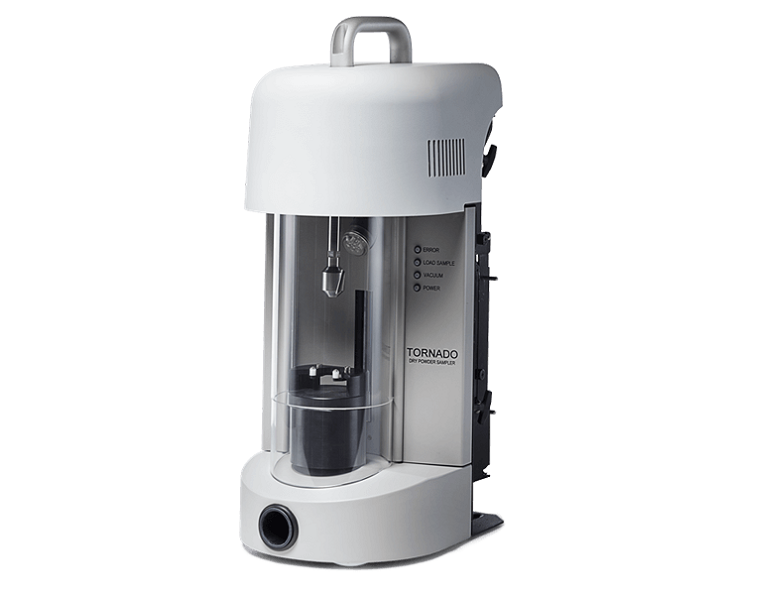
Dry Analysis with the Tornado Module
For dry powders or granular samples, the Tornado Module provides an efficient, contamination-free solution.
Dry analysis is especially useful for larger particles and materials incompatible with liquid dispersion.
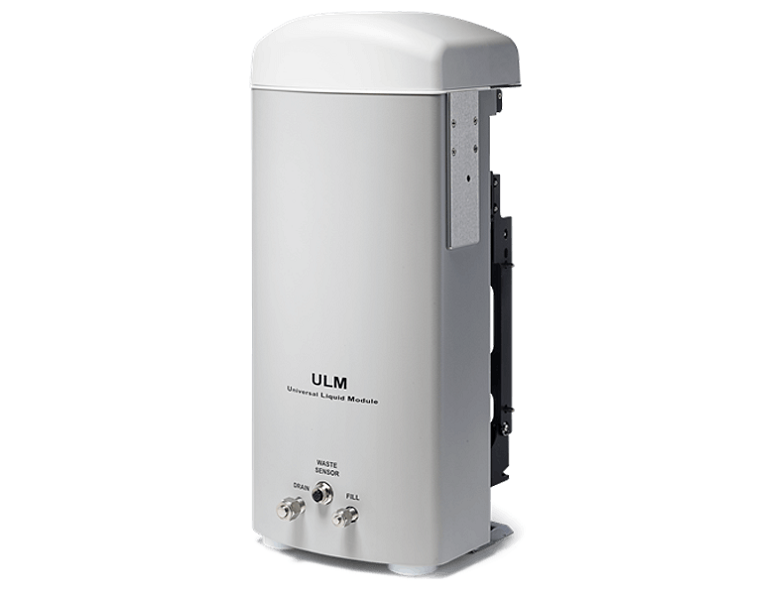
Wet Analysis with the Universal Liquids Module (ULM)
The Universal Liquids Module (ULM) is designed for wet dispersion, ideal for materials dispersed in liquids such as emulsions, suspensions, or fine powders requiring stabilisation.
Wet analysis using the LS13320XR is a simple, easy to use technique and is highly effective for particles down to the nanometer scale, offering detailed insights into fine particle systems.
By offering robust solutions for both wet and dry methods, the Beckman Coulter LS13320XR enables accurate, reproducible particle size measurements tailored to specific sample requirements. Whether optimising formulations or ensuring quality control, this system delivers exceptional flexibility and precision.
Our porometers can be applied to the characterization of polymeric and ceramic membranes for micro and ultrafiltration applications with pore sizes ranging from 500 μm down to 2 nm. Flat sheet, tubular and hollow fibers can be measured by using an appropriate sample holder.
Best solutions
Both POROLUX™ series and POROLIQ™ series are suitable for membrane characterization as they offer fast and reproducible determination of first bubble point, mean flow pore size, smallest pore, pore size distribution, cumulative flow distribution & gas permeability.
Thanks to the unique designed components to guarantee the most accurate measurement of pressure and flow, and the intuitive and easy to use software, our porometers are the preferred partners of membrane scientists all over the world!
Contact us know to find out the most suitable model for you!
Comparing FlowCam Results with Light Obscuration: A Study by Japan’s National Institute of Health Sciences
In their recent publication, Quantitative Evaluation of Insoluble Particulate Matters in Therapeutic Protein Injections Using Light Obscuration and Flow Imaging Methods, Shibata et. al. compare the ability of Light Obscuration and Flow Imaging to detect and accurately characterize subvisible particles in injectable drugs.
The team at Japan’s National Institute of Health Sciences write the following:
Flow imaging (FI) has emerged as a powerful tool to evaluate insoluble particles derived from protein aggregates as an orthogonal method to light obscuration (LO). However, few reports directly compare the FI and LO method in the size and number of protein particles in commercially available therapeutic protein injections. In this study, we measured the number of insoluble particles in several therapeutic protein injections using both FI and LO, and characterized these particles to compare the analytical performance of the methods. The particle counts measured using FI were much higher than those measured using LO, and the difference depended on the products or features of particles. Some products contained a large number of transparent and elongated particles, which could escape detection using LO. Our results also suggested that the LO method underestimates the size and number of silicone oil droplets in prefilled syringe products compared to the FI method. The count of particles ≥10mm in size in one product measured using FI exceeded the criteria (6000 counts per container) defined in the compendial particulate matter test using the LO method. Thus precaution should be taken when setting the acceptance criteria of specification tests using the FI method.
The results of this study corroborate the results produced in our FlowCam lab, comparing particle counts and sizes produced by the two technologies in our new instrument, FlowCam LO. Our recently produced White Paper, “Measuring Subvisible Particles and Aggregates Using FlowCam LO”, uses FlowCam LO to directly compare the particle size distributions of aqueous samples containing Polystyrene Latex calibration beads, ETFE particles, and IgG aggregates. Download our White Paper to see the results of the study. FlowCam LO uses two orthogonal techniques in a single instrument by combining our patented flow imaging microscopy technology with an embedded light obscuration particle counter. FlowCam LO provides an even more direct particle count comparison because a single aliquot of sample is analysed by both technologies in one sample run, instead of two samples from the same vial or syringe.
The most versatile particle characterisation instrument: Bettersizer 2600
Meritics Ltd offers the Bettersizer 2600, a cutting-edge particle size analyser that utilises proven Laser Diffraction Technology to measure particle sizes ranging from 0.02 to 2,600 μm. Its modular design allows for flexible functionality, with the option to incorporate a dynamic imaging module. This combination of laser and imaging extends the measurement range up to 3,500 μm and enables comprehensive particle size and shape analysis. Additionally, the system supports both dry and wet dispersion methods, making it suitable for a broad spectrum of measurement applications.
Bettersizer 2600 with all modules for particle size and image analysis
Features and Benefits: • Wide particle size range: 0.02 to 2,600 μm (wet dispersion), 0.1 to 2,600 μm (dry dispersion), and 2.0 to 3,500 μm (dynamic imaging) • Dual optical system: Laser Diffraction and Dynamic Imaging for comprehensive analysis • Advanced laser diffraction: Incorporates both Fourier and inverse Fourier designs for enhanced precision • 92 distributed spherical detectors: Captures light signals from 0.016° to 165° for accurate measurements • Auto-alignment: Automatically aligns the laser diffraction system, removing the need for manual adjustments • Modular dual-camera imaging: Provides 24 detailed particle parameters for in-depth analysis • Interchangeable dispersion units: Supports seamless switching between dry and wet dispersion methods • User-friendly software: Designed for efficiency and ease of operation • Regulatory compliance: Meets ISO 13320, 21 CFR Part 11, USP <429>, and ISO 13322-2 standards
Interested? Contact Meritics today to arrange a demo – 01582 704807 info@meritics.com www.meritics.com
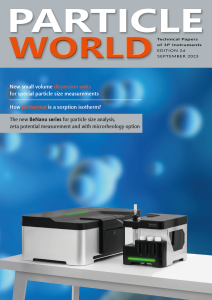
The 24th edition of our application magazine “Particle World” is released!
Our “Particle World 24” has just been published. Read about the characterisation of particles, powders, and pores of various materials in pure or dispersed form. New measurement possibilities and recommendations for their implementation, experiences in carrying out analyses and evaluation are presented on 32 pages.
A highlight is the technical article on the newBeNano instrument series: now with autotitrator and DLS microrheology option! The BeNano series is the latest generation of optical measuring instruments for the comprehensive characterisation of particles in the size range 0.3 nm to 15 µm. The flagship BeNano 180 Zeta Pro combines the methods ofdynamic light scattering (DLS), electrophoretic light scattering (ELS) and static light scattering (SLS). This allowsparticle size, rheology parameters, zeta potentialandmolecular weightto be determined in one system. In the article starting on page 9, the new autotitrator for automatic, time-saving pH-dependent determination of the zeta potential is presented using a sample measurement with bovine serum albumin (BSA). In addition, the new microrheology option is clearly explained step by step and it is shown which statements can be derived with it about the viscoelastic properties of the materials to be examined.
Other topics in the latest “Particle World” include:
Bettersizer line: Newsmall-volumedispersion units for specialparticle size measurements
Powder characterisation– methods and equipment at a glance
Howisothermalis an isotherm?
The influence of thesorption method sensitivity factor(SMSF) to gas sorption measurements
Invitation to theAdsorption event seriesand review of our Adsorption Week 2023
New cooperationwith Rubolab:magnetic suspension balanceandhigh-pressure adsorption analysernow in our portfolio
New Altamira series forcatalyst characterisation
Extract from our range ofcontract measurements
We hope you enjoy reading it! Do you have questions about one of the articles or would you like to write your own article in the next issue? Do you wish to receive the print version free of charge?
Gold Standard Cell Counts, Cell Size, and Viability
The Moxi V provides a combination of volumetric cell sizing (Particle Sizer) with simultaneous fluorescence (Flow Cytometer) to provide the most accurate cell counts, size, and viability in the industry. Specifically, the Moxi V employs the Coulter Principle to precisely measure the volumetric particle size of each particle for exact size measurements down to 3µm in diameter (14fL volume), easily distinguishing between cells and debris. The system is also equipped with a 532nm laser and a 561nm/LP detection channel for robust cell viability analysis. Propidium Iodide (PI)-stained dead cells measure 50-100 times brighter fluorescence on the system than do live cells, removing the ambiguity associated with traditional Trypan Blue viability assessments. For each test, these size and viability measurements are applied, individually, to up to 23,000 cells in a matter of a few seconds. This ensures the highest level of precision and statistical robustness. As the fluidic volume is precisely metered as well, the particle counts are presented as an exact cell concentration.
The Moxi V employs a patented, single-use, microfluidic flow cell. The flow cells eliminate the hassle of traditional flow cytometers and Coulter Counters, eliminating the need for cleaning, maintenance, clearing of clogs, cross contamination and occasionally replacement of bottles and tubes. The Moxi V uses very little sample volume, 60µl’s, allowing you to conserve your precious, potentially expensive, sample (e.g. stem cells). Cell concentrations as low as 10 cells/µl are possible, typically requiring just 5µl’s of cell sample diluted in 55µl’s of PBS.
Some key features of the Moxi V include:
True Cell Viability Counts 50-100x more sensitive than vision counters.
Precision Sizing. Uses the Coulter Principle to get precise cell volumes with CVs less than 3%.
Highly Accurate. Accurate counts for smaller cells down to 3µm (i.e. nuclei, RBCs). Uniquely accurate at low cell concentrations down to 10 cells/µl.
Rapid Assays. Offers a <15 second test that counts up to 23,000 cells compared to 200-300 counts on most vision counters, eliminating the need for triplicates.
The Moxi V system comes standard with an ultra-intuitive, plug-and-play interface with free OS updates for as long as you own the instrument. No prior flow cytometry experience is required – you simply just plug and play
Raptor: Petroleum Lost Circulation Material (LCM). Particle Size and Shape Analysis – CCM Type #1
Lost Circulation Material (LCM) is an additive introduced to drilling fluid that can come in all different shapes and sizes.
When drilling fluid escapes into porous or fractured formations, it can disrupt the drilling process. LCMs are added to the drilling mud to seal these fractures or voids, helping to maintain proper pressure and flow, and ensuring efficient drilling operations. Common LCMs include materials like fibres, granules, and particulate substances that help plug and seal the lost circulation zones.
It is well understood that irregular particles have greater thickening and strength properties. As a result, analysing size alone for selection of LCM materials would not be ideal. In this case, shape measurements such as Circularity and Smoothness as well as size, are key measurement parameters to monitor.
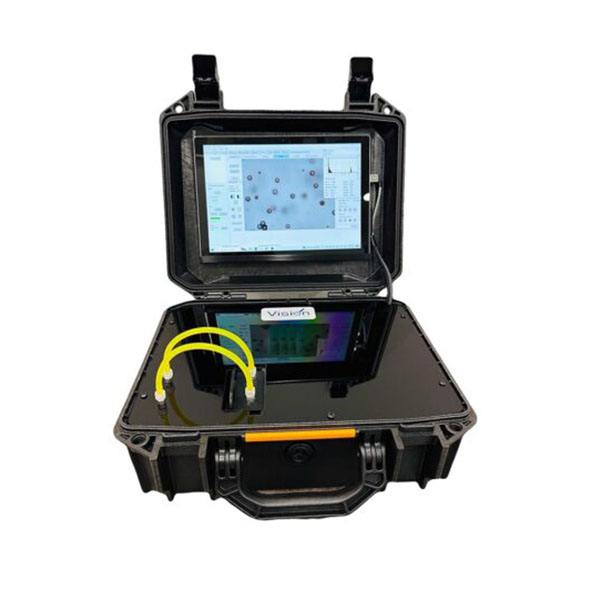
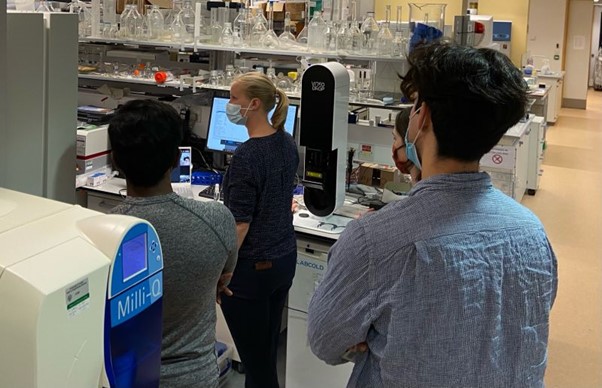
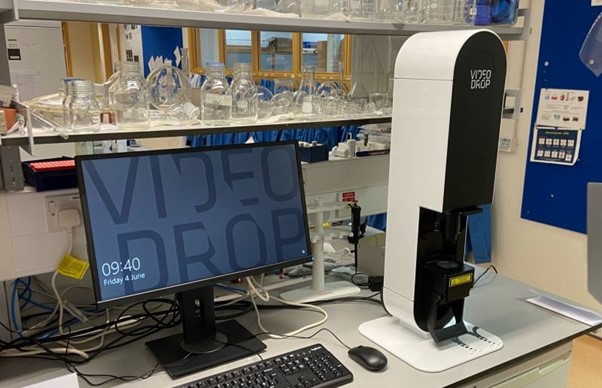
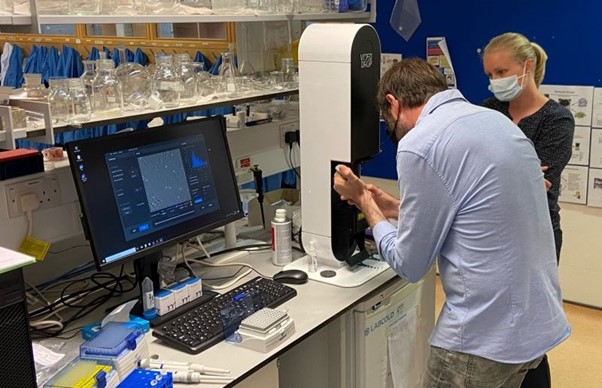
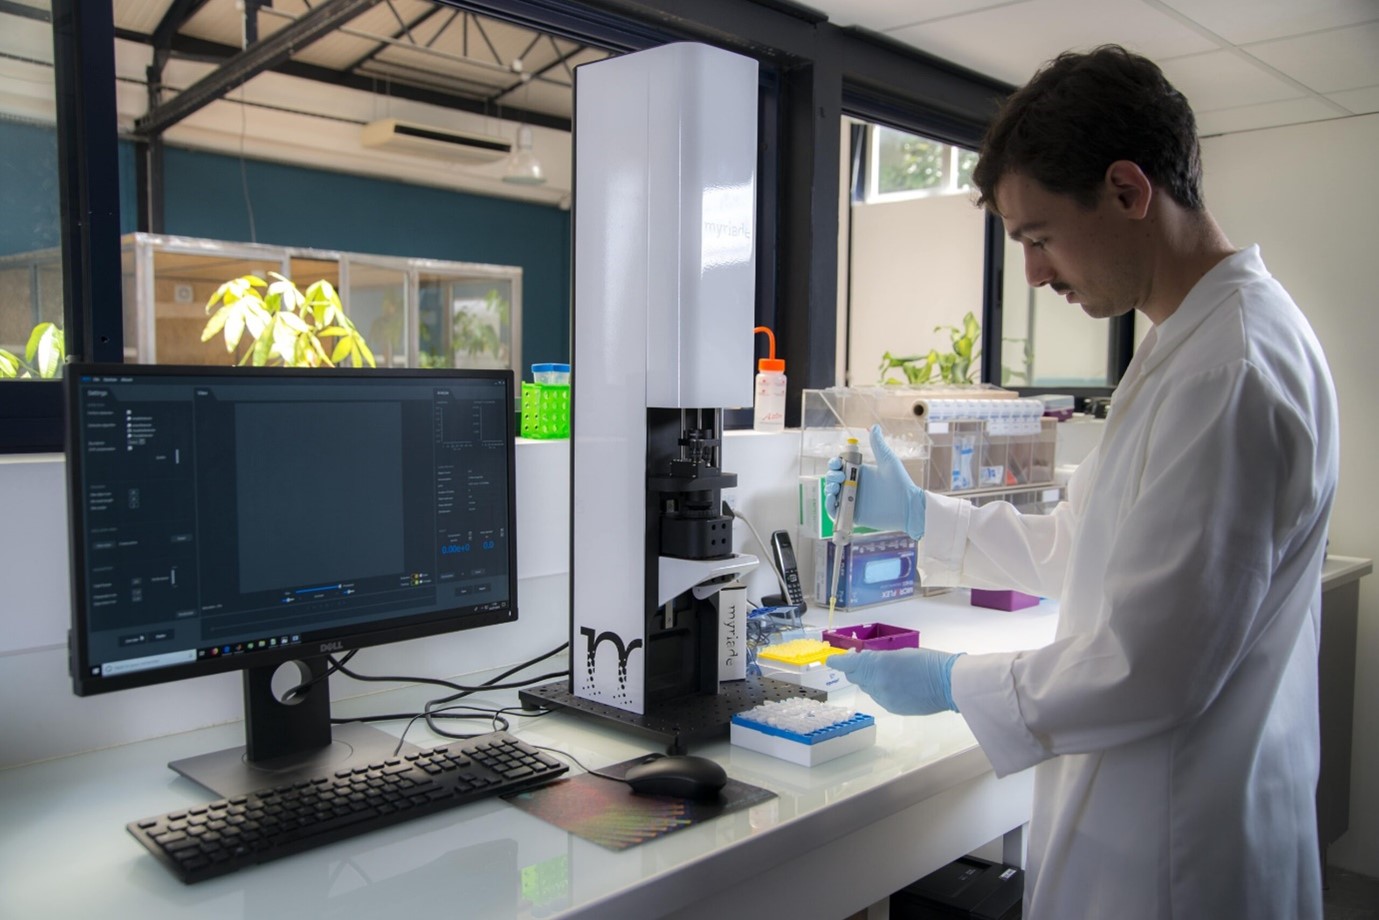
Meritics are delighted to announce that we are now offering demonstrations of the Myriade Videodrop.
Based on the principles of interferometry, the Videodrop makes it possible to visualise living nanoparticles in the range of 30 nm and 10 microns without labelling, in real time and in a single drop.
The Videodrop processing algorithms compute the concentration and size distribution of the nanoparticles and enable to analyse complex mixtures of phages (T4, lambda) for applications in phagotherapy, continuously monitor viral vector solutions (Lentiviruses, adenoviruses) for gene and cell therapy, and distinguish the different types of EVs to vectorize, diagnose or treat.
Low field NMR Instrument for Complex Nanoparticle Suspension Characterisation
The Mageleka RelaxoMeter is ideal for routine analysis of complex multi-component nanoparticle solid-liquid, liquid-liquid formulations using non-invasive technology based on NMR proton relaxation.
In every industrial application a knowledge and understanding of the molecular structure and dynamics at the particle-liquid interface is critical to improving or optimising suspension and emulsion product performance at every stage from initial formulation to final manufacture. The RelaxoMeter provides direct information about the extent and nature of any particle-liquid interface of suspensions and emulsions in a matter of minutes.
Applications include batch-to-batch reproducibility in manufactruing, formulation development, kinetic processes, surfactant and competitive surfactant adsorption, aggregation, flocculation, sedimentation studies, presence of para – ferro-magnetic impurities, oxygen and water content of solvents, polymer and solvent viscosity and additive studies.
Industries served include catalyst, pharmaceutical and personal health care providers, paints. Pigments and coatings, ceramics, refractories, agrochemicals, cosmetics, batteries, electronics, nano medicine and graphene/graphene oxides.
This month, we bring you a new particle detective app video & app note, a collection of chemicals app notes, BeNano Series with flow mode, online store, and free sample testing service.
Hope you will enjoy!
Particle Detective
Hunting for Clues in Battery
Join particle detective Viola as she hunts for clues to improve the energy density of EV batteries, which is crucial for extending electric range. Watch Now
In this application note, find out how the Bettersizer S3 Plus can be a valuable tool for measuring particle size and shape to determine the energy storage capacity of the anode in LIBs. Download Now
This collection features six application notes showcasing the BeNano Series’ capabilities in analyzing diverse chemical materials, including polymer standards, surfactant micelles, copolymer latex, silica suspensions, aluminum oxide, and titanium oxide.
Download the collection and gain insights into selecting and applying effective techniques for your specific chemical analysis.
Frustrated with low-resolution particle sizing? The new BeNano is now equipped with DLS flow mode to transform your research. Combined with GPC/SEC or FFF, DLS flow mode can offer high-resolution size results, with better than 1.3x resolution to distinguish monomers, dimers, and aggregates in a polydisperse sample.
Get the brochure now to learn how BeNano and its DLS flow mode can empower your nanoparticle size measurements.
Advancing Pharmaceutical Excellence with Laser Diffraction Analysis & The LS 13 320 XR
In pharmaceuticals, precision is everything. Ensuring optimal drug efficacy, stability, and bioavailability hinges on consistent particle size, and laser diffraction analysis is at the forefront of this innovation. Drug Formulation: With laser diffraction, we guarantee consistent particle size, crucial for delivering optimal drug performance. Quality Control: The LS 13 320 XR by Beckman Coulter revolutionises particle size monitoring during production, ensuring unparalleled product quality. Its advanced technology offers: -High-resolution measurements for accurate particle size distribution. -Rapid Liquid/Powder/Emulsion analysis to streamline production processes. -Broad size range capabilities from 10 nanometers to 3,5 millimeters. -User-friendly ADAPT software for easy data interpretation. -Robust design ensuring reliable and consistent performance. Embrace the future of pharmaceutical manufacturing with the LS 13 320 XR, where precision meets innovation. Here is the link to the product page:
Meritics, in partnership with Beckman Coulter, excels in Laser Diffraction Analysis using the LS 13 320 XR. Our expertise in this technology allows us to deliver precise and reliable particle size measurements, enhancing material characterisation for diverse applications. This collaboration underscores our commitment to advanced analytical solutions and industry-leading accuracy.
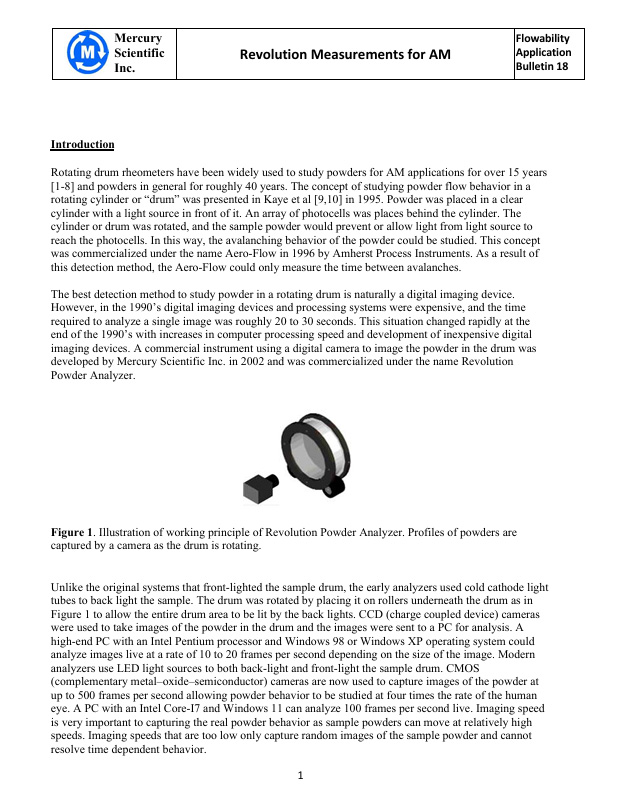
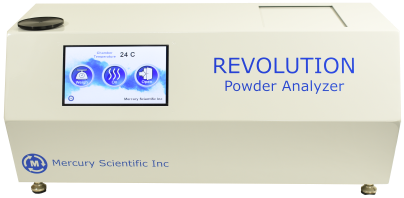
Revolution Measurements for Additive Manufacturing
Rotating drum rheometers have been widely used to study powders for Additive Manufacturing applications for over 15 years [1-8] and powders in general for roughly 40 years. The concept of studying powder flow behaviour in a rotating cylinder or “drum” was presented in Kaye et al [9,10] in 1995. Powder was placed in a clear cylinder with a light source in front of it. An array of photocells was places behind the cylinder. The cylinder or drum was rotated, and the sample powder would prevent or allow light from light source to reach the photocells. In this way, the avalanching behaviour of the powder could be studied. This concept was commercialised under the name Aero-Flow in 1996 by Amherst Process Instruments. As a result of this detection method, the Aero-Flow could only measure the time between avalanches.
The best detection method to study powder in a rotating drum is naturally a digital imaging device. However, in the 1990’s digital imaging devices and processing systems were expensive, and the time required to analyse a single image was roughly 20 to 30 seconds. This situation changed rapidly at the end of the 1990’s with increases in computer processing speed and development of inexpensive digital imaging devices. A commercial instrument using a digital camera to image the powder in the drum was developed by Mercury Scientific Inc. in 2002 and was commercialised under the name Revolution Powder Analyser.
FlowCam: Particle Analysis for Materials Characterisation
We talk a lot about FlowCam for biopharmaceutical and aquatic applications. The high-quality images resulting in detailed morphologic data are ideally suited for these applications – to discriminate among different kinds of particles and cells like aggregates, contaminants, and other outliers. VisualSpreadsheet provides an easy-to-use method to sort and identify particle images based on their shape and 40+ attributes.
Beyond standard particle sizing and counting, FlowCam is also an exceptional tool for performing materials testing in accordance with compliance and cleanliness standards. Customers are using FlowCam across a broad range of applications to compare advanced particle shape data between different lots and production steps to detect process flaws and improve product performance, quality, and safety. Keep reading to learn more about the many different kinds of materials FlowCam can image and analyse.
Dirt, fibres, and debris always seem to make their way into finished components – especially in aerospace, automotive, electronic, and hydraulic systems. Water used to wash devices or components after manufacturing is analysed to determine what and how many particles are present. Traces of fibres, metals, and plastics that remain from the manufacturing process may cause product failures. FlowCam makes it easy to sort and filter particle data and build libraries to automatically quantify and characterise each particle type.
Superabrasives, such as micronized diamonds and cubic boron nitride (CBN), are used extensively in applications for cutting, grinding, and drilling hard materials. Particle size and shape play an important role in the durability and effectiveness of these superabrasive grinding tools. As it turns out, shape uniformity is a critical quality attribute where particles with smooth and rounded edges are most effective! FlowCam provides particle morphology analysis and can report on what percentage of particles meet uniformity standards around circularity and aspect ratio.
Who knew that geometry would play such a crucial role in the performance of fibres in different applications? Shape factors that influence performance include length, width, and curl. Despite the importance of fibre geometry, many conventional particle sizing measurements struggle to accurately capture the morphology of these particles.
FlowCam excels in this process with integrated fibre morphology parameters that include geodesic length, geodesic thickness, fibre straightness, and fibre curl. Using these advanced measurements, FlowCam provides more accurate and reliable data than volumetric-based methods and offers significant time-savings over manual microscopy.
FlowCam aids in assessing seed viability and studying plant development defects. There is an interesting cross-over application with the pharmaceutical industry when FlowCam is used to analyse the shape and intactness of pollen shell capsules in drug delivery systems. FlowCam is also a valuable tool in agriculture applications for identifying and monitoring soil microbes, mites, forest litter invertebrates, and nematodes contributing to crop health.
FlowCam is essential formicroencapsulation research and quality controlacross various industries including food, beverage, pharmaceutical, cosmetics, and fragrances. It provides unique insights into the microencapsulation process by dynamically monitoring capsule formation over time, allowing for optimisation and clean coacervate formation.
Ingredients play a vital role in the food and beverage industry. Taste and texture are important quality attributes determined by particle size and shape. Leveraging flow imaging microscopy, you can identify diverse particle types within a mixed composition to achieve quality standards and pinpoint operational inefficiencies. With its high-throughput capabilities, FlowCam is perfect for identifying variations in particle size, shape, and structure, streamlining the quality control process.
Did you know that the size and shape of printer toner particles can considerably impact the image resolution and efficiency of a printer’s output? The uniformity of these particles also impacts the distribution of charge they carry, which can ultimately influence the overall quality of images. Utilising FlowCam for image characterization can aid in identifying the size, shape, circularity, and material consistency of printer toner particles throughout the production process and lead to overall improved quality.
Have we piqued your interest in learning more about FlowCam for materials characterisation? Download ourmaterials applications brochureand let us know what you think.
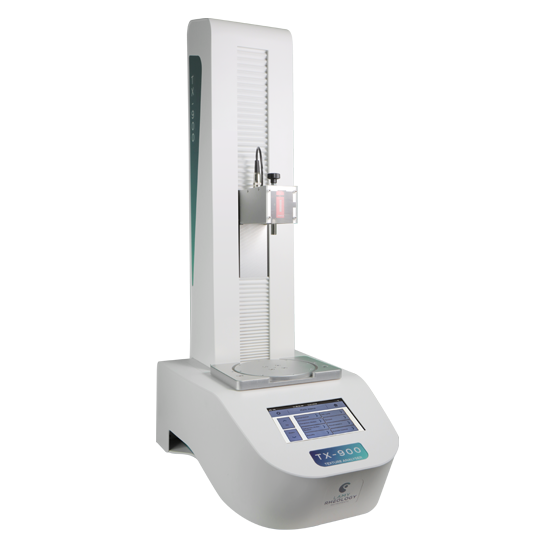
Using same probe and fixture as TX-700, this new device has been developed to increase travel distance up to 40 cm (instead 22cm for TX-700). All other specification still the same as we have for TX-700.
What’s new in Texture Analysis?
With its wide range of probes and cells, the New TX-900 is the ideal tool for your texture analysis with its 400mm travel distance. Thanks to its touch screen directly displaying the curves, its method programming capability, storage and analysis of measurements, the TX-900 will integrate in laboratory and production area.
Integrated adjustable turntable: diam. 160 mm.
Table for attaching inserts: 120 x 220 mm.
Available Operating Modes: Compression – Relaxation –Tensile – TPA Cycle – Penetrometry and relative compression mode also.
Large selection of probes available and custom probes can be made with choice of material, shape and size according to your criteria.
The TX700 has a large 7’’ colour touch screen which allows comfortable use and optimal viewing of measurements.
Storage of your measuring methods.
Data can be backed up and exported using a USB stick.
External control thanks to the optional software.
Texture Analysis Specialists
Need to know more?
Contact one of our friendly team for more information.
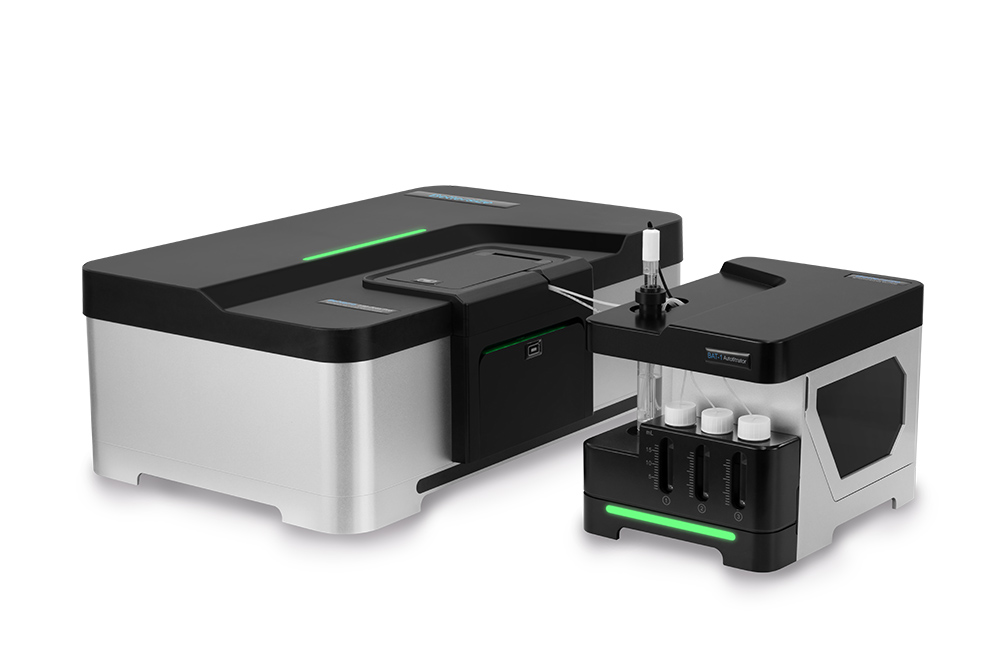
Revolutionising particle analysis from Pharmaceuticals to Nanomaterials: The Bettersize BeNano 180 Zeta Pro with BAT-1 Autotitrator
When it comes to precise particle analysis, look no further than the Bettersize BeNano 180 Zeta Pro with the BAT-1 Autotitrator. This state-of-the-art instrument is revolutionising particle analysis, enabling precise analysis from pharmaceuticals to nanomaterials. Whether you’re working in chemical engineering, pharmaceuticals, food and beverage, inks and pigments, or life sciences, the BeNano Series offers unparalleled accuracy and efficiency.
The BeNano Series is the latest generation of nanoparticle size and zeta potential analysers designed by Bettersize Instruments. It seamlessly integrates Dynamic Light Scattering (DLS), Electrophoretic Light Scattering (ELS), and Static Light Scattering (SLS) to deliver reproducible measurements of particle size, zeta potential, and molecular weight. Giving you data you can trust time and time again, no matter the complexity of your samples.
What truly sets this instrument apart is the inclusion of the BAT-1 Autotitrator. Measuring the isoelectric point, a critical property for many applications, can be both time-consuming and challenging. However, with the BeNano and the Autotitrator, this task becomes effortless. Making the process not only easy to carry out but also highly efficient, delivering accurate, repeatable results with minimal effort.
In both academic and manufacturing settings, the BeNano Series stands out as a reliable and advanced tool for nanoparticle analysis, offering precise, dependable measurements, enhancing the quality and reliability of your research and production processes.
The BeNano is available in the UK from Meritics Ltd.
4 Applications of Enhanced Laser Diffraction Analysis
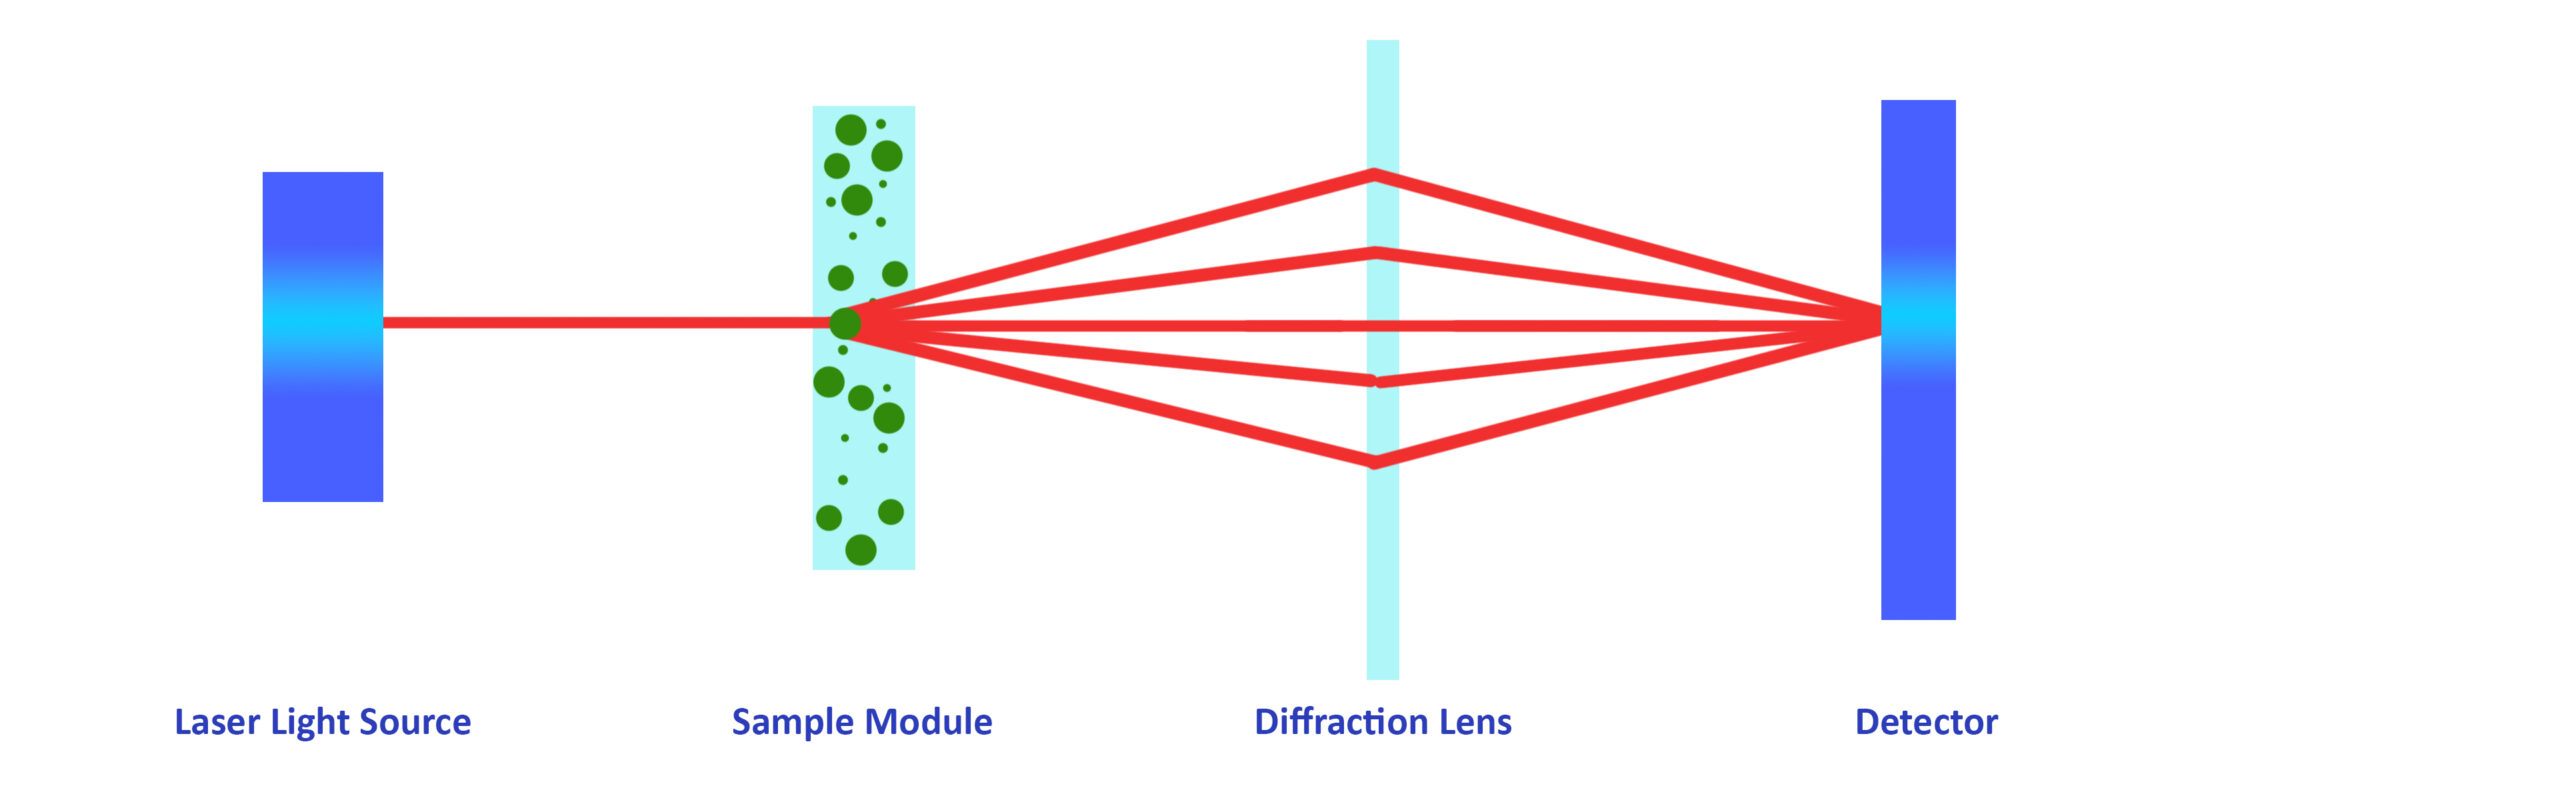
Particles diffract light through a specific angle depending upon their size, creating a diffraction pattern of light and dark circles. Measuring the intensity of light over a wide range of angles enables analysts to determine a particle size distribution. Laser diffraction analysis operates on this general principle.
Mie and Fraunhofer Diffraction Theories
Gustav Mie’s theory of diffraction is used in an array of light scattering applications, including laser diffraction analysis. It requires some knowledge of the particle and suspending fluid’s optical properties to acquire accurate data. An approximation of the Mie theory by Fraunhofer was developed for applications where the size of a particle is larger than the wavelength of light being diffracted. This eliminated the need for prior knowledge of the optical properties as they have minimal effects on data.
Fraunhofer’s approximation of Mie theory is typically used to measure particles of up to 30µm. To provide reliable and accurate particle size distribution measurements, good resolution of the angular pattern of the diffracted light is required, alongside a large number of detectors (>100).
As particle size decreases, the angle through which light is diffracted gets bigger and the intensity smaller, which makes detection of the actual angle of diffraction difficult. Below 1µm, it becomes virtually impossible to distinguish light from different particle sizes, and impossible below 0.4µm. Using more than one wavelength of light helps to quantify this but only marginally and some instruments use curve fitting type routines to estimate data below the measuring limits.
Overcoming the difficulties of measuring sub micron particles
Sub-micron particles scatter polarised light differentially depending on the polarisation and wavelength. Enhanced laser diffraction analysis uses this property to provide real measured size distributions rather than estimates down to 10nm (0.01µm). It measures the intensity of polarised light at 3 additional wavelengths. The difference in intensity between the vertically polarised and horizontally polarised light (Polarisation Intensity Differential Scattering – PIDS) provides information on the quantity and sizes of particles in this region. This can be integrated into the Mie theory calculation for quantifiable size distribution measurements.
This enhanced measurement range provides the basis for dynamic materials characterisation and particle measuring for a broad range of industrial, academic, and commercial sectors.
This blog post will explore four common applications of enhanced laser diffraction analysis.
1. Soil Studies The enhanced laser diffraction particle size analyser is used to measure particle or grain size of soil and sediment samples, a property that can be indicative of how a soil has formed.
2. Pigment Sizing Laser diffraction analysis enabled with polarisation intensity differential scattering (PIDS) can measure particles down to the nanometer scale (nm) by sequentially illuminating a sample with wavelengths of alternately polarised light. This method has been used to reliably size pigment particles as small as 10 nm.
3. Quality Control of Chemical Compounds Enhanced laser diffraction analysis is uniquely suited to quality control (QC) applications with a superior resolution and unmatched dynamic range compared to conventional laser diffraction techniques. It provides a rapid assessment of the particle size distributions in powder or liquid samples, with well over 100 light detectors enabling the resolution of subtle differences in particle size.
4. Research and Development Laser diffraction analysis for R&D purposes can be complex as some instruments require prior knowledge of a sample’s particle size characteristics, such as whether a single peak of particles is expected or if they may be more than one population of particles such as aggregates. The LS 13320 XR enhanced laser diffraction analyser does not require this information. The software carries out complex and comprehensive analysis of the diffraction patterns to provide an accurate particle size distribution without any need for the operator having to guess at the expected result.
Enhanced Laser Diffraction Analysis with Meritics
Meritics is the UK’s leading supplier of particle analysis instrumentation for an extensive range of applications. We work with cutting-edge technology manufacturers to provide the most advanced measurement systems available.
The LS 13 320 XR is our most enhanced laser diffraction analysis tool. It is capable of performing in all the aforementioned applications and more. If you would like any more information, please do not hesitate to contact us.
Powders can behave very differently depending on the amount of energy they are subjected to as they move through handling equipment. One powder may flow more evenly as it is subjected to more mechanical energy while another powder may become erratic. This behaviour can be studied using the Revolution Multi-Flow Test Method. In the multi-flow method, the sample drum speed is increased gradually over time and the sample powder’s behaviour is measured.
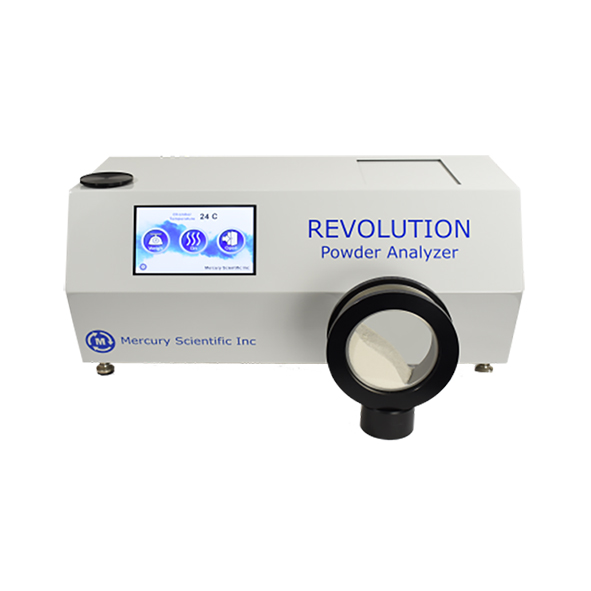
“The Mercury Scientific Revolution Powder Analyser excels in powder analysis, offering exceptional accuracy and efficiency. Its advanced design makes it essential for researchers and manufacturers seeking superior quality control and processing.”
The Multi-Flow Analysis studies how a powder or granular material transitions from avalanching to continually flowing as it is subjected to faster speeds. By gradually increasing the rotation speed in the Multi-Flow Analysis, the user can evaluate the speed at which their powder is no longer avalanching in their process but flowing continuously. This data can be used to predict how powders will behave in high speed equipment.
The Revolution is available in the UK exclusively from Meritics Ltd.
Determining the particle characteristics of various products and biological materials is increasingly reliant on the measurement of particle concentration, alongside particle size. It is a crucial metric in a range of industries and academic studies, where products are manufactured to microscopic parameters or where quality assurance – or research – must be maintained and carried out at a molecular level.
The process of measuring particle concentration is important to researchers and engineers in biopharmaceuticals, protein aggregation studies, nanomaterial characterization, and more..
This article will explore in more detail the various industries and schools of research which measure particle concentration:.
Nanomaterials are commonly referred to as a material with particles of nanoscale dimensions of between 1 – 1000 nanometers (nm). In 2011, the European Commission clarified that definition to include specific requirements of particle concentration for a material to be categorically defined as nanomaterial. It describes a nanomaterial as: “A natural, incidental or manufactured material containing particles, in an unbound state or as an aggregate or as an agglomerate and where, for 50 % or more of the particles in the number size distribution, one or more external dimensions is in the size range 1 nm – 100 nm.”.
Precise measurement of particle concentration is required to ensure that any new materials are correctly identified and regulated accordingly. This is a crucial metric for materials scientists in a range of fields to consider..
Pharmaceutical
Studying the particle concentration of cell biology allows scientists and researchers to accurately assess drug delivery and optimize biological responses to drug administering by measuring the particle concentration of the delivery vector. It can also help industry leaders to understand drug stability under a range of environmental factors such as temperature and humidity, influencing best practice on how to manufacture and administer a wide range of pharmaceuticals..
Laboratory tests that measure the particle concentration and size of antibodies, white and red blood cells, and platelets in a blood sample are commonly performed in the development and manufacture of vaccines, particularly in the assessment of vaccine dosages and their subsequent performances. It is a crucial factor in the evaluation of immunization success and the analysis of perceived biological resistances.
Despite innovations in emergent materials for use in a range of commercial and emergency service sectors, natural sediments and soils are still a primary material for the implementation of flood protection, foundation-laying for construction, and of course, agriculture. Measuring the particle concentration of soil helps to characterize the applications of various soil samples, for example in the distinction of soil types ideal for drainage and aeration from those that are highly compatible with various crops.
Water Treatment
Specialists in the water treatment sector are required to perform consistent and precise assessments of the cleanliness of drinking water for human consumption. Dedicated metric hardware that analyses the particle concentration of drinking water can quickly determine that samples are free of contaminants, including solids and bacteria, ensuring that water treatment is carried out to stringent industry standards.
Particle Analysis Solutions from Meritics
Meritics is the UK’s leading supplier of particle characterization instruments and laboratory services, with a range of accurate and reliable equipment that is applicable to many disparate fields. These include:
FlowCam Flow Imaging Microscopy (FIM), which can distinguish particles such as protein aggregates from other contaminants from 3μm to several hundred microns, with the provision for accurate particle shape analysis;
The Multisizer 4e, which is the most broadly applied particle counting and sizing instrument, providing high resolution and excellent statistical accuracy, with a sizing range of 0.2µm – 1600µm.
If you would like any more information on the applications of the particle concentration analyzers we supply, please do not hesitate to get in touch.
Geometry can play a crucial role in the performance of fibres in
different applications. Shape factors that influence performance
include length (i.e. size of the longest dimension of the fibre), width
(i.e. size of the shortest dimension), and curl. Despite the importance
of fibre geometry, many conventional particle sizing measurements
struggle to accurately capture the morphology of these particles.
Volumetric-based particle sizing methods such as laser diffraction
and Coulter Counters assume particles exhibit spherical geometry
and only report equivalent spherical diameter (ESD) measurements.
Manual microscopy, the primary method used for measuring fibre
length and width, is low-throughput and labour-intensive to perform.
Flow imaging microscopy (FIM) instruments like FlowCam are an
automated, high-throughput alternative to manual microscopy for
fibre analysis. VisualSpreadsheet® software acquires and analyses
images of fibrils, providing automated measurements of not only
fibre length and width but also fibre straightness and curl from
particle images similar to those obtained via manual microscopy
(Figure 1). As FIM instruments capture fibre images in a flowing
fluid, this technique offers much higher throughput than manual
microscopy. These features make FlowCam an ideal instrument for
rapid, automatic fibre analysis.
Fibre measurements in VisualSpreadsheet
Most particle imaging systems use Feret measurements to determine
the length and width of particles. Feret measurements involve finding
edges on opposite sides of a particle that are parallel to each other
and measuring the distance between these edges. The shortest
Feret measurement is reported as particle width, and the longest
is reported as particle length (Figure 2). These Feret measurements
are recorded as the “Length” and “Width” parameters reported
by VisualSpreadsheet. While these measurements are accurate for
symmetric and straight particles, Feret measurements dramatically
undersize the length and oversize the width of curved particles.
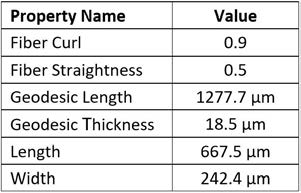
VisualSpreadsheet also records Geodesic measurements of particle
lengths and widths. Geodesic measurements account for the arcing
of particles like fibres, thus providing a more accurate representation
of fibre length and width (Figure 2). In VisualSpreadsheet, these fibre
measurements are reported as geodesic length and geodesic thickness.
Figure 3 shows a comparison between these measurements for a
straight fibre and for a curved fibre. Reported values for length (Feret)
and geodesic length of the straight fibre are relatively similar, as are
those for width (Feret) and geodesic thickness. When these values
are compared for the curved fibre, the length (Feret) measurement
is much lower than the geodesic length measurement, and width is a
much larger value than the geodesic thickness measurement. While
the length (Feret) measures the long-axis distance covered by the
particle, the geodesic length factors the curvature of the particle into
its reported length and is thus more accurate. Similarly, the geodesic
thickness is more accurate as it primarily accounts for the width of the
particle and not the short-axis distance covered by the particle.
Other fibre measurements available in VisualSpreadsheet include
fiber straightness and fibre curl. Fiber straightness is the ratio
of length (Feret) to geodesic length. Higher straightness values
indicate better agreement between the Feret and geodesic length
measurements, corresponding to straighter particle geometry.
Fiber curl is calculated by dividing geodesic length by length (Feret)
and subtracting one. A particle with a fibre curl of zero is perfectly
straight and increasing curl values indicating higher degrees of
curling. Figure 4 shows fibre measurement data for a curved wood
fibre with a relatively high fibre curl value and relatively low fibre
straightness value.
Using fibre measurements to evaluate samples
In applications where fibre morphology is important for quality
control of fibrous materials, VisualSpreadsheet can be used to
build and save custom filters that automatically report counts and
concentrations of particles matching a particular specification. For
example, if fibre straightness is of concern, pre-built filters can
automatically report a percent of fibres that meet or exceed a user defined
fibre straightness threshold.
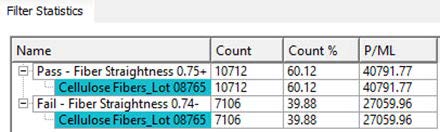
Figure 5 shows data for custom value filters created for bleached
softwood cellulose microfibrils at a specific stage of the refining
process. For this example, at least 50% of the fibres must have fibre
straightness ≥ 0.75 for a lot to pass quality control. After each lot of
fibres is analysed, the filter bins instantly populate with a percentage
of particles matching the passing criteria, allowing operators to
quickly assess whether a particular lot has passed.
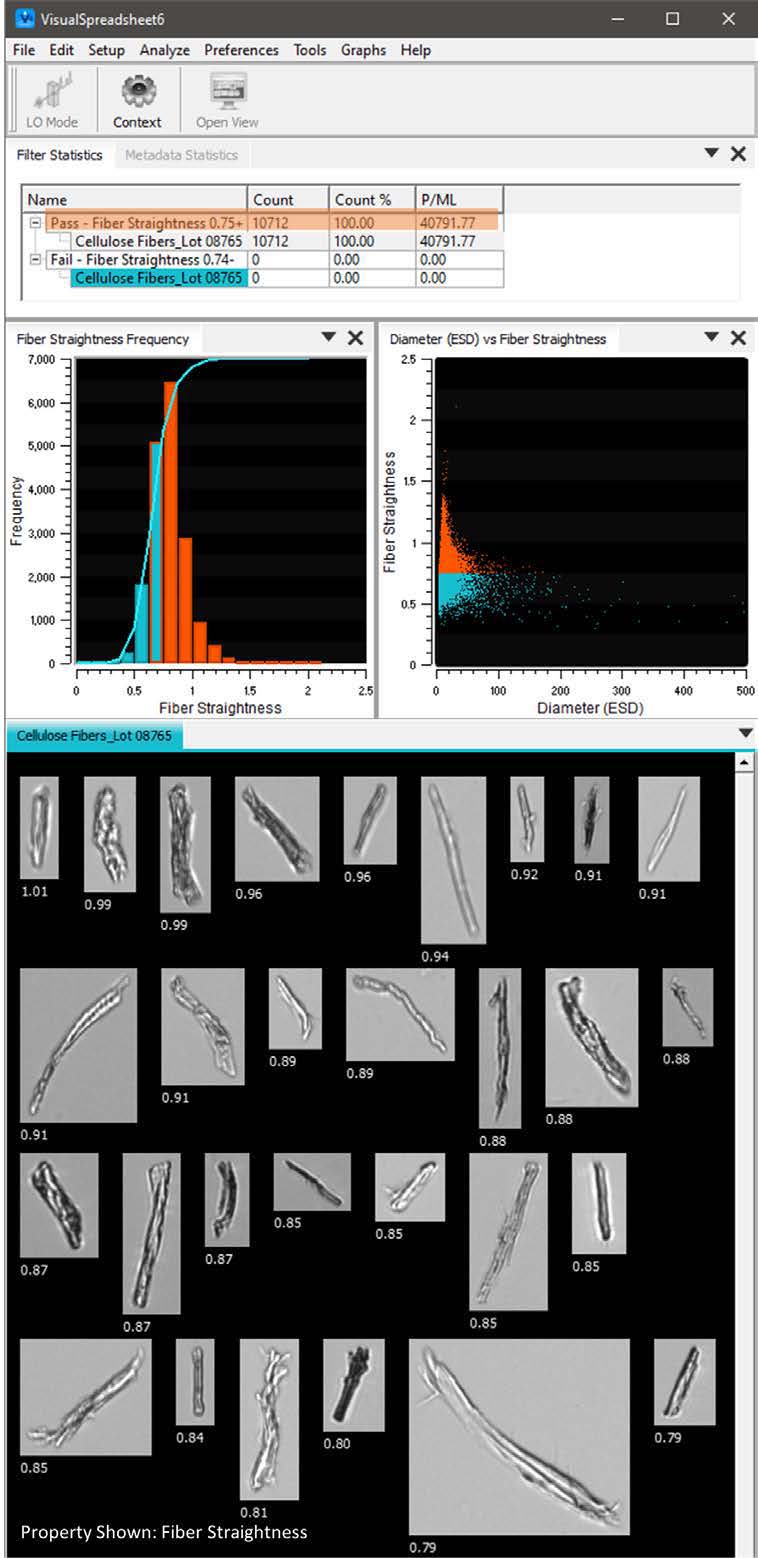
An added benefit of VisualSpreadsheet is the ability to directly
interact with the filter grid and data plots. By selecting the “Pass –
Fibre Straightness 0.75+” filter, particle images that match the filter
will automatically display in the View Window (Figure 6, next page).
These particle images can then be sorted, selected, and/or saved.
Regions of histograms or scatterplots that contain particles matching
the filter will also be highlighted. Data can be easily exported into
Excel or as a PDF document for a seamless reporting and archiving
process.
Conclusion
FlowCam is a powerful analytical tool that expedites and streamlines
fibre analysis. Integrated fibre morphology parameters include
geodesic length, geodesic thickness, fibre straightness, and fiber curl.
Using these measurements, FlowCam provides more accurate and
reliable data than volumetric-based methods and offers a significant
time-savings over manual microscopy. The option of building custom
filters in VisualSpreadsheet allows for instantaneous reporting of
results at the conclusion of sample analysis, saving users time and
effort in assessing fiber quality.
Particle Size: An Important Factor in Many Applications
Particle size is the physical property that describes the size of individual particles in a material. It is an important factor in many applications and industries, ranging from pharmaceuticals, cosmetics, and food production to chemical processing and construction. In this blog post, we will dive into the importance of particle size and how it can impact various applications.
What is Particle Size?
Particle size refers to the size of individual particles that make up a material. The size of these particles can vary greatly, from nanometers to millimeters. The most common way to measure particle size is through the use of a particle size analyser.
Importance of Particle Size
Particle size is an important factor in many fields and industries. In the pharmaceutical industry, for example, the size of drug particles can impact their absorption rate by the body. The smaller the particles, the greater the surface area, which leads to faster absorption. In cosmetics, particle size affects the texture and feel of the product. For instance, in sunscreens, smaller particle sizes are used to allow for easier and more even application, while still providing the UV protection.
In food production, particle size plays an important role in texture and taste. For example, in baking, the particle size of flour can impact the final texture of the baked goods. Particle size also affects the solubility and flow of powders, which is important in the chemical industry. The size of particles in paint can affect its appearance and the ease of application.
The Impact of Particle Size on Properties
Not only does particle size affect the properties of a product or material, but it can also be used to control those properties. For example, in the production of catalysts, the size of the particles can affect their reactivity. By controlling the particle size, researchers can tune the catalytic activity of the material. In the development of drug delivery systems, particle size can be used to control release rates and the stability of the particles.
Conclusion
Overall, particle size is a crucial factor to consider in many applications. The size of individual particles can impact the properties and performance of a material or product. By understanding particle size and its effects, researchers and manufacturers can optimize their products and improve their efficiency.
The electro-kinetic potential of colloids is known as its zeta potential. This is the difference in charge repulsion/attraction between mobile particles in a dispersion fluid, and the stationary layers of ions which have attached to the surfaces of insoluble nanoparticles dispersed throughout the medium.
Zeta potential measurement is performed by dispersing nanoparticles in a liquid medium of varying pH levels, and applying an electrical field throughout the colloid. Using dynamic light scattering (DLS) equipment, it is possible to observe the nanoparticle’s motion (velocity) and interaction with ions in the dispersive medium. Charged dispersion particles will form a series of layers on the surface of the nanoparticle, collectively known as the electrical double layer, which comprises an initial skin of charged ions and a secondary diffuse outer layer. As the nanoparticle moves through the dispersion, the particles attached in these layers exhibit different electrostatic properties to those particles forming the bulk of the dispersion fluid.
This electro-kinetic activity is significant in the characterization of product stability, providing insights into the formulations of emulsions and aiding product optimization through rapid and accurate assessments of additive success.
Applications for Zeta Potential Measurement
Zeta potential measurement is a significant particle analysis method in particle aggregation studies and the establishment and optimization of emulsion short and long-term physical stability.
Zeta potential measurement has shown that dispersions with a charge close to zero – whether exhibiting a positive or negative charge – tend to yield shorter shelf-lives, with an inclination towards coagulation or flocculation of emulsions. Conversely, emulsions with a surface activity greater than ~ +/- 30mV are inclined towards improved system stability and low aggregation.
Zeta potential measurement is therefore an important consideration for the accurate establishment and forecasting of product shelf lives, particularly as a screening method for the control of repeated batch consistency.
Particle analysis such as zeta potential measurement is increasingly important in the food and beverage sector, where mass-production and packaging of food and beverages for worldwide sales must meet stringent mandatory compliance criteria and performance standards. End products must consistently deliver on taste and texture, they must be reproduceable on large scales, and they must advertise accurate shelf lives for safe human consumption. Zeta potential measurement can not only provide accurate data towards shelf-life forecasting, it can aid in research of potential additives to improve zeta potential, thereby increasing product stability.
Zeta Potential Management Products from Meritics
Meritics are particle size and zeta potential measurement experts, providing services and instruments to academic and commercial sectors alike, where precise and consistent measurements are fundamental to achieving repeatable results for studies or for the manufacture of consumer products.
Meritics provide zeta potential measurement systems suitable for all levels of research, development, and manufacturing, allowing for rapid analysis of particle properties and characteristics. The Bettersize BeNano 180 Zeta Pro is a zeta potential and particle size analyser capable of simultaneous assessment of particle size and zeta potential in as little as one second, with instant results cross-checking. This accurate rapidity is crucial to the optimisation of high-quality, fast-moving consumer goods.
It is very important in measuring zeta potential that the time and level of current passing into the sample are minimised to avoid any possible damage to the sample, particularly biological materials. In the Bettersize BeNano 180 Zeta Pro from Meritics, both particle size and zeta potential are measured simultaneously, and in just a couple of seconds minimising any potential sample damage and also allowing measurements of aggregation to be made over short periods of time. To minimise the appearance of gas bubbles which can interfere with the zeta potential measurement.
If you would like any more information about our Zeta Potential measurement instruments, or any of our other products, please do not hesitate to get in touch.
Select and order the ideal instrument to meet your powder density testing needs now from the Bettersize online store. Submit your order here
BeDensi T Pro Series – Tapped Density Tester HFLOW 1 – Flowmeter Funnel BeDensi B1-S – Scott Volumeter for metallic powders BeDensi B1 – Bulk Density Tester for non-metal powders BeDensi P – Bulk Density Tester – Plastic BeDensi AR – Angle of Repose Tester
Want to test your sample before you buy? Submit your sample here


 Advancing Pharmaceutical Excellence with Laser Diffraction Analysis & The LS 13 320 XR
  Drug Formulation: With laser diffraction, we guarantee consistent particle size, crucial for delivering optimal drug performance.
 Quality Control: The LS 13 320 XR by Beckman Coulter revolutionises particle size monitoring during production, ensuring unparalleled product quality. Its advanced technology offers:
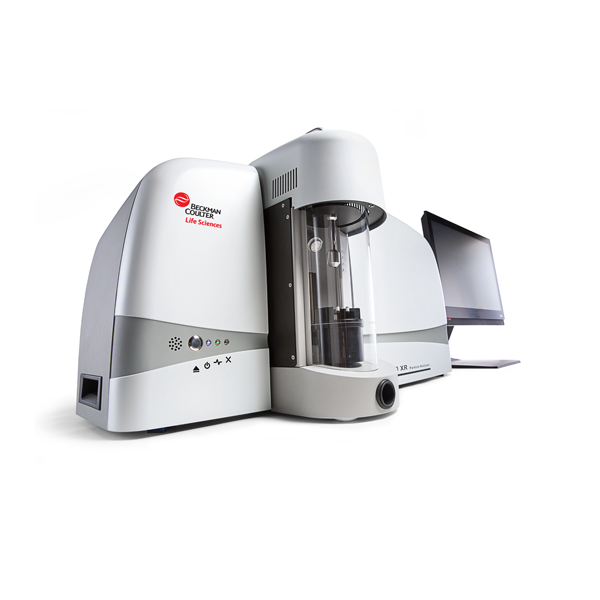


 BeDensi T Pro Series – Tapped Density Tester
 HFLOW 1 – Flowmeter Funnel
 BeDensi B1-S – Scott Volumeter for metallic powders
 BeDensi B1 – Bulk Density Tester for non-metal powders
 BeDensi P – Bulk Density Tester – Plastic
 BeDensi AR – Angle of Repose Tester