Breakthrough curves: dynamic sorption of gas- and vapor mixtures
Investigation experiments of practically relevant separation processes by standard gas sorption instruments for pore size analysis are limited.
Regarding the assignment of tasks such as
- investigation of the adsorption of CO2 from dry and wet air
- adsorption of methane of biogas
- differentiation of practically relevant sorption behaviour of adsorbents like gas or vapor mixtures.
- BET- or pore size distribution cannot predict or model separation processes.
The dynamic flow method is applied for practical investigation such as
- dynamic gas flow adsorption and desorption
- determination and evaluation of breakthrough curves
- investigation of sorption kinetics
- investigation of co-adsorption and replacement effects
- determination of sorption selectivities
- determination of sorption equilibria of gas mixtures
- transfer of technical sorption processes to lab-scale
- investigation of thermal balance of dynamic adsorption processes
Measuring method
The figure above shows a breakthrough curve of CO2 at activated carbon measured with the mixSorb L. The vertical, red line marks the start of the breakthrough measurement. From this point a gas mixture of 5 Vol.-% CO2 in Helium flows through the adsorbent at a pressure of 5 bar at 40 °C with a flow of 1 L min-1. The black line represents the concentration of CO2 at the end of the adsorber column. One can observe that after 15 minutes traces of CO2 are detected. Before that time CO2 is completely withheld by adsorption on the activated carbon followed by a steep increase of the CO2 concentration, which is called mass transfer zone. From the shape of the breakthrough curve in this zone different parameters concerning sorption kinetics or concentration distribution can easily be determined. After approximately 30 minutes the activated carbon reaches the maximum sorption capacity under this experimental conditions. Consequently the CO2 concentration at the end of the column approaches the initial CO2 concentration.
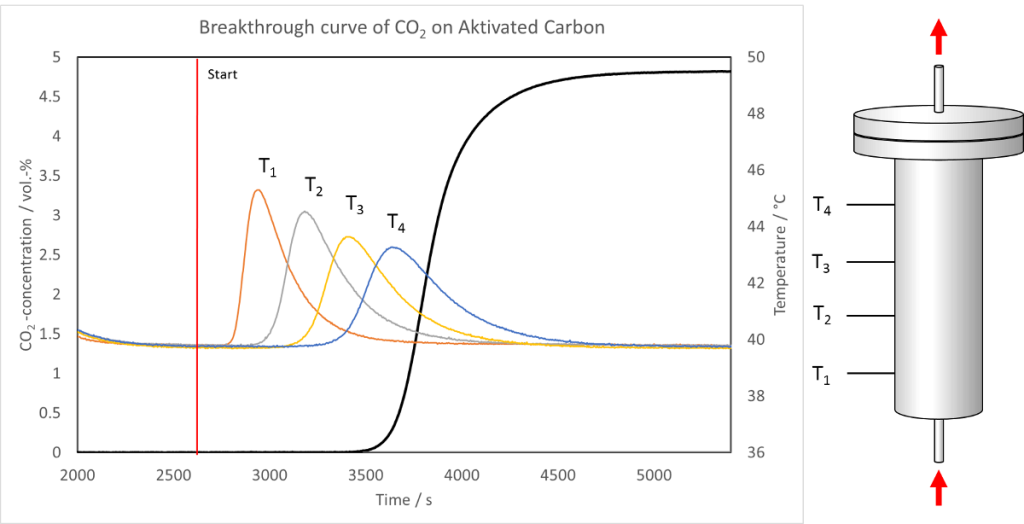
The releasing heat of sorption results in a temperature increase of the adsorber bed. To follow this process the mixSorb L is equipped with four temperature sensors along the adsorber. Their position is sketched at the right side of the figure. The four sensors respond in accordance to the direction of the gas flow starting with T1 and ends with T4. The measured temperature curves (orange, grey, yellow and blue) are also depicted. They give information of the released heat, the speed of energy exchange processes and the dispersion of the concentration profile in the adsorber column.
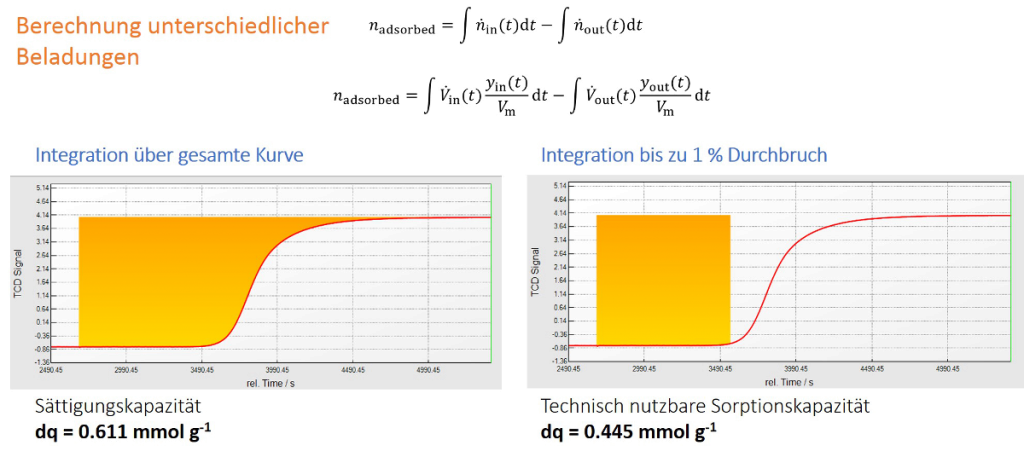
The following figure illustrates how to determine the technical usable sorption capacity from a breakthrough curve under certain experimental conditions. The BET surface area or the micropore volume, which are exactly known by standard gas sorption methods, are not accessible completely in technical flow processes for certain kind of purification or separation processes. As an example: The separation of CO2 from N2 (40 °C, 2 L min-1, 5 bar, initial gas composition: 5% CO2 in N2) occurs with the breakthrough of CO2 when the sorption capacity reaches 75% of the maximum sorption capacity. The dynamic sorption analyzer mixSorb L can help to predict technical relevant sorption processes in an easy a quick way.