Author: amanda-meritics

Very helpful and prompt

I emailed for some technical help and also to get some spares and both the engineer (David) and purchasing (Sophie) were very prompt to respond and helpful. We do have a service contract but I appreciated being able to email the engineer directly.

AlexH-474

Excellent Service

Used Meritics to conduct particle size distribution by laser diffraction. Service as last time, is very quick, well priced and professional.

I would highly recommend

GavinR-101

Excellent and Friendly Service

Always a pleasure to deal with the people at Meritics Ltd. They understand the importance of our work and the fact that our research projects have deadlines that need to be met. Consequently, problems are dealt with very quickly and professionally and they are willing to go that one step further to make sure their supply chain problems don’t become our problems. Thank you to the team for their support. It is greatly appreciated.

JanetH-255

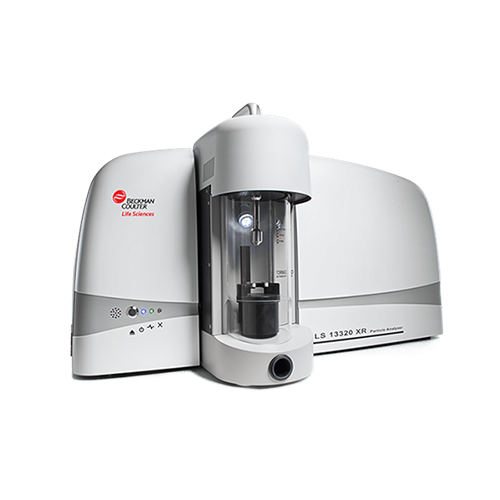
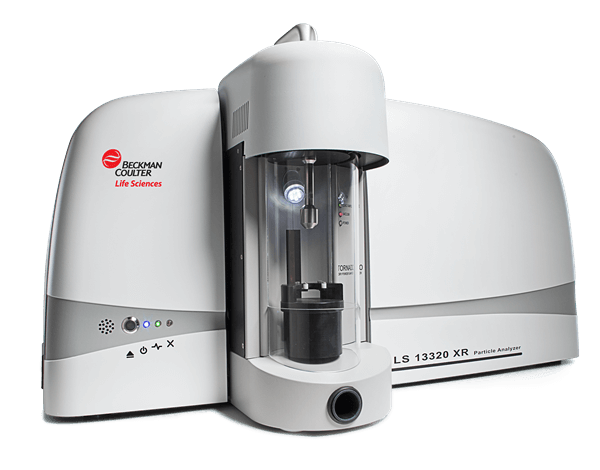
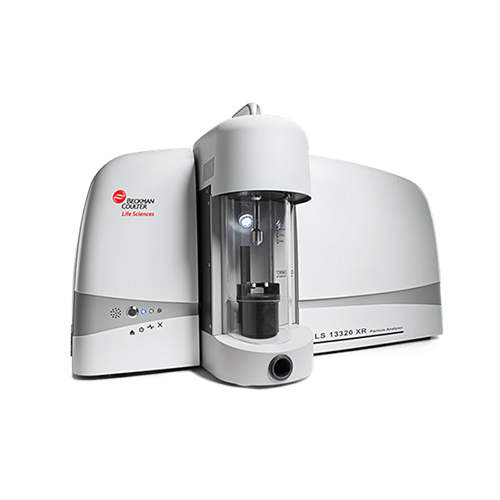
LS 13 320 XR

Beckman Coulter
LS 13 320 XR

Laser Diffraction Particle Size Analyser 

  • Expanded measurement range 10 nm – 3,500 µm
  • Enhanced PIDS Technology
  • Real data down to 10nm

Download
brochure
   Request
quote

Beckman Coulter LS 13 320 XR Laser Diffraction Particle Size Analyser 21 CFR Part 11

Beckman Coulter LS 13 320 XR Particle Size Analyser

For big improvements that help you spot small differences.

The LS 13 320 XR Particle Size Analyser offers best-in-class particle size distribution data from advanced PIDS technology,* which enables high-resolution measurements and an expanded dynamic range. Like the LS 13 320, the XR particle size analyser provides fast, accurate results, and helps you streamline workflows to optimize efficiency. Some big improvements help you reliably spot small differences that can have a huge impact on your particle analysis data.

  • Direct measurement range from 10 nm – 3,500 µm
  • Automatically highlights pass/fail results for faster quality control
  • Enhanced software that simplifies method creation for standardised measurements
  • New control standards to adequately verify instrument/module performance

The LS 13 320 XR Particle Size Analyser is an easy-to-use laser diffraction analyser that yields fast, reliable particle size analysis data for dry and aqueous and non-aqueous samples.

  • Key Features

    Spot Small Differences

    • Particle Size Analyser with expanded measurement range: 10 nm – 3,500 µm
    • Laser diffraction plus advanced Polarization Intensity Differential Scattering (PIDS) technology enable high-resolution measurement & reporting of real data down to 10 nm
    • Provides accurate, reliable detection of multiple particle sizes in a single sample
    Easy-to-use Software

    • ADAPT Software features automatic pass/fail check
    • Pre-configured methods deliver results with 3 clicks or less
    • Simplifies analyser operation by experts & novice users alike
    • 1-click overlay with historical data
    • Intuitive user diagnostics keep you informed during sampling
    • Simplified method creation for standardised measurements
    ADAPT Software enables 21 CFR Part 11
    • Customisable security system to meet diverse needs
    • Choose from 4 security levels
    • High-security configuration supports 21 CFR Part 11
    PIDS Technology* for Direct Detection of 10 nm Particles
    • 3 light wavelengths (450, 600, & 900 nm) irradiate samples with vertical & horizontal polarized light
    • Analyser measures scattered light from samples over a range of angles
    • Differences between horizontally & vertically radiated light for each wavelength yield high-resolution particle size distribution data
  • Technical Specs

    Technology

    Low-angle forward light scattering with additional PIDS(Polarization Intensity Differential Scattering) Technology. Analysis of vertical and horizontal polarized light at six different angles using three additional wavelengths. Full implementation of both Fraunhofer and Mie Theories.

    Light Source

    Diffraction: Laser Diode (785 nm)
    PIDS: Tungsten lamp with high-quality band-pass filters (475, 613 and 900 nm)

    Particle size analysis range

    Measurement range: 10 nm – 3,500 µm
    Dry Powder System Module (DPS): 400 nm – 2,000 µm
    Universal Liquid Module (ULM): 10 nm – 2,ooo µm

    Electrical interface

    USB

    Power consumption

    ≤ 6 amps @ 90 – 125 VAC
    ≤ 3 amps @ 220 – 240 VAC

    Temperature range

    10 – 40°C (50 – 104°F)

    Humidity

    0 – 90% without condensation

    Compliance

    Creates 21 CFR Part 11 enabling features
    RoHS
    Certifications:
    – EU EMC Directive 2014/30/EU
    – CISPR 11:2009/A1:2010
    – Australia and New Zealand RCM Mark

    Data export file formats

    XLSX, TSV, PDF

    File import capability

    From all LS 13 320 Legacy and LS 13 320 XR system

    *Software operating system

    Requires Microsoft Windows 10, 64-bit environment
    (US, English regional settings only)

    Dimensions

    Height: 19.5″ (49.53 cm)
    Width: 37″ (93.98 cm)
    Depth: 10″ (25.4 cm)

    Weight

    52 lbs (23.5 kg)

  • Accessories

    Dry Powder System

    Analytical size range: 400 nm – 3,500 µm

    • Measures entire sample as required by the ISO 13 320 Standard
    • Programmable Obscuration setting to optimize sample feed rate
    • User-selectable vacuum pressure for maximum dispersion control

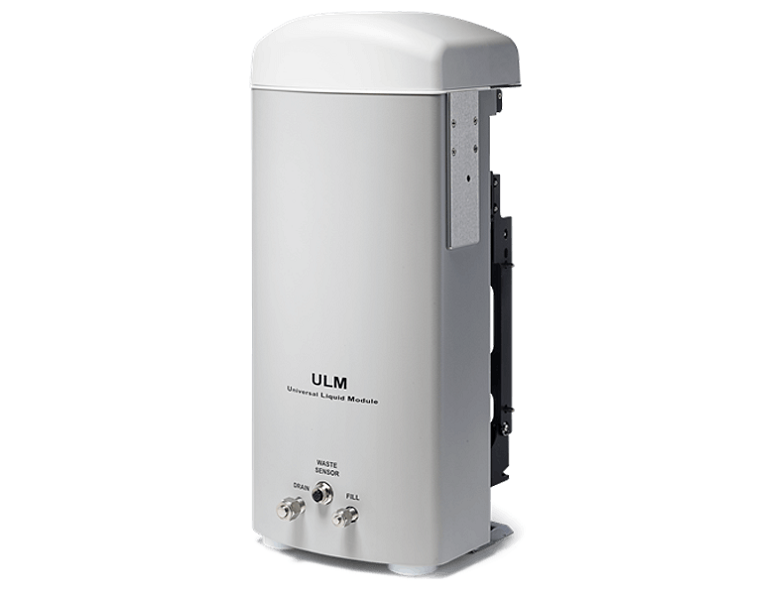
    Universal Liquid Module

    Analytical size range: 10 nm – 2,000 µm

    • Fully automatic with auto-dilution, auto-filling and auto-rinsing
    • Analyses samples suspended in aqueous as well as non-aqueous diluents for maximum flexibility
    • Wetted materials list: Teflon®, 316 Stainless Steel, Glass, Kal-rez® and PEEK

    Sonicator Control Unit
    • Needle probe sonicator for additional dispersion control of wet samples
    • Fully adjustable power settings
    • In-situ sonication with ULM before/during the run, can also be operated external to module

    EU Vacuum Cleaner
    • Vacuum pressure range fully adjustable
    • Integrated vacuum control unit for optimised vacuum/obscuration settings
    • Two vacuum systems to choose from
  • Applications

    Soils

    Nanocellulose

    Pigments

    Cement

  • Capabilities

    The LS 13 320 XR particle size analyzer uses advanced laser diffraction and PIDS technology for the sizing of non-spherical, sub-micron particles. Initially, particle sizing by laser diffraction was limited to the use of the Fraunhofer diffraction theory. Laser diffraction offers a number of advantages – laser diffraction analyzers go beyond simple diffraction effects. General approaches are now based on the Mie theory and the measurement of scattering intensity over a wide scattering angular range is employed.

    Using PIDS Technology

    Pioneered by Beckman Coulter, most laser diffraction manufacturers use the above two approaches, i.e., wide angular detecting range and short wavelength, to size small particles. However, sizing even smaller particles (tens of nanometers in diameter), cannot be achieved using only these two approaches. Any further increase in scattering angle will not yield any significant improvement due to the everslower angular variation. Figure 2 is a 3-D display that illustrates the very slow angular variation for small particles. For particles smaller than 200 nm, even by taking advantage of the above two approaches, it is still difficult to obtain an accurate size.

Not sure if it’s the right instrument?

No worries, send us a sample and we will test it for you


Send a sample

Continue reading

Aggregates

Biological Information
Aggregates

Characterising Biological Aggregates

Characterisation of protein aggregates involves analysing size, morphology, and distribution using techniques like dynamic light scattering (DLS), Surface Plasmon Resonance (SPR) and Flow Imaging Microscopy (FIM). This helps understand aggregation mechanisms, assess stability, and ensure safety and efficacy in pharmaceuticals, reducing immunogenicity risks and optimising formulation and storage conditions.

Dynamic light scattering (DLS)

Dynamic light scattering (DLS) characterises protein aggregates by measuring their size distribution in solution, providing insights into aggregation state, stability, and polydispersity, crucial for pharmaceutical formulation and quality control.

Surface plasmon resonance (SPR)

Surface plasmon resonance (SPR) characterises protein aggregates by measuring binding interactions and kinetics on sensor surfaces, providing insights into aggregation behavior, affinity, and stability, crucial for therapeutic protein development and quality assurance.

Flow Imaging Microscopy (FIM)

Flow Imaging Microscopy (FIM) characterises protein aggregates by capturing high-resolution images in a flowing sample, allowing precise analysis of size, shape, and concentration, essential for assessing protein formulation stability and quality.

Case study

A biotech firm faced challenges with protein aggregation affecting drug stability. Utilising ViewSizer 3000, they analysed aggregates across a wide size range, obtaining precise size distribution and concentration data. Results guided formulation adjustments, enhancing drug stability and efficacy.

The instrument’s multi-wavelength light scattering accurately detected and sized particles, providing real-time visualization. This enabled informed decisions on storage conditions and formulation optimization. Ultimately, the ViewSizer 3000 facilitated robust quality control measures, ensuring the therapeutic integrity of the biopharmaceutical product.

Instruments to support charcterisation of Aggregates

Applications to support characteristion of Aggregates

Continue reading

Automotive

Industry Information
Automotive

Why particle characterisation is important in the automotive industry

Particle characterisation is a crucial process in the automotive industry that involves the analysis and understanding of the properties and behaviour of particles present in various automotive components. These particles can be found in engine lubricants, brake pads, fuel, and many other materials used in cars.

Image Analysis

Automated image analysis has been developed to provide users with a more accurate measurement of their particles. This is particularly used for particles which are not spherical, for example glass fibres to ensure they are the correct diameter and length.

Laser Diffraction Particle Size Analysis

Particle size analysis in the automotive industry ensures optimal performance of lubricants, fuel additives, and coatings. Precise measurements enhance engine efficiency, reduce emissions, and improve overall vehicle reliability and longevity.

Surafce Area Analysis

Surface area analysis in the automotive industry ensures material quality and performance, optimising coatings, catalysts, and filtration systems for enhanced efficiency, durability, and environmental sustainability in vehicles.

Case study

We are continually looking to enhance the durability and safety of our vehicles. One aspect of this is optimising the quality of glass fibres used in composite materials. Using the Pi Sentinel PRO shape analyser, we are able to scrutinise the morphology of individual fibres to ensure uniformity and strength.

By utilising Image Analysis coupled with the image processing algorithms in the software, the we are able to precisely measure key parameters such as length, diameter, and aspect ratio of the fibres. This allows us to identify any irregularities or inconsistencies in fibre shape that could compromise structural integrity.

Instruments to support your industry

Applications to support your industry

Continue reading

Paints, Pigments, Inks and Coatings

Industry Information
Paints, Pigments, Inks and Coatings

The importance of Particle Charaterisation in Paints and Pigments

Particle characterisation plays an essential role in the production of paints and pigments by providing detailed information about the particles which can be used to control production processes and ensure consistency in the quality of the final product. In this blog post, we will discuss the importance of particle characterisation in the paint and pigment industry, looking at how it contributes to the quality control of products and the overall performance of the process.

Particle Size in pigments

Particle size, for example, plays a significant role in determining the appearance, texture, and durability of paints and pigments. Smaller particles tend to improve the overall quality, as they allow for a smoother finish and better colour distribution. On the other hand, larger particles can result in uneven coverage and a rough texture, affecting the aesthetic appeal and longevity of the paint or pigment.

Additionally, understanding the composition and distribution of particles is crucial for maintaining consistency and quality control in the production process. By characterising particles, manufacturers can ensure that their products meet the desired specifications and perform consistently over time.

Particle characterisation solutions Meritics offer

Various methods are employed for particle characterisation, including microscopy, laser diffraction, and dynamic light scattering. These techniques provide detailed information about particle size distribution, shape, and surface properties, enabling manufacturers to make informed decisions about formulation and production processes.

Case study

A printer toner manufacturer came to us wanting a faster solution for quality control checks on their printer toner.

They had previously been using a microscope which was effective but time consuming. We demonstrated the FlowCam and they were blown away by the speed at which it captured, processed and then analysed their data.

The uniformity of the printer toner particles is of great importance to the manufacturer because a better grading of toner produces a better end-customer experience; as printer heads don’t get clogged as much, leading to less maintenance, more reliable printers and more sales.

They purchased an instrument and we helped with their method development and helped them to set up their Quality Control filter to enable them to run very simple overall quality report on every particle on every run.

Instruments to support your industry

Applications to support your industry

Continue reading

Particle Size: An Important Factor in Many Applications

Particle Size: An Important Factor in Many Applications

Particle size is the physical property that describes the size of individual particles in a material. It is an important factor in many applications and industries, ranging from pharmaceuticals, cosmetics, and food production to chemical processing and construction. In this blog post, we will dive into the importance of particle size and how it can impact various applications.

What is Particle Size?

Particle size refers to the size of individual particles that make up a material. The size of these particles can vary greatly, from nanometers to millimeters. The most common way to measure particle size is through the use of a particle size analyser.

Importance of Particle Size

Particle size is an important factor in many fields and industries. In the pharmaceutical industry, for example, the size of drug particles can impact their absorption rate by the body. The smaller the particles, the greater the surface area, which leads to faster absorption. In cosmetics, particle size affects the texture and feel of the product. For instance, in sunscreens, smaller particle sizes are used to allow for easier and more even application, while still providing the UV protection.

In food production, particle size plays an important role in texture and taste. For example, in baking, the particle size of flour can impact the final texture of the baked goods. Particle size also affects the solubility and flow of powders, which is important in the chemical industry. The size of particles in paint can affect its appearance and the ease of application.

The Impact of Particle Size on Properties

Not only does particle size affect the properties of a product or material, but it can also be used to control those properties. For example, in the production of catalysts, the size of the particles can affect their reactivity. By controlling the particle size, researchers can tune the catalytic activity of the material. In the development of drug delivery systems, particle size can be used to control release rates and the stability of the particles.

Conclusion

Overall, particle size is a crucial factor to consider in many applications. The size of individual particles can impact the properties and performance of a material or product. By understanding particle size and its effects, researchers and manufacturers can optimize their products and improve their efficiency.

Continue reading

Soils Application Note

Particle Size Distribution
Soils

Using Laser Diffraction in Folk and Ward Phi Notation

Soil Granulometry Application Note

Abstract

This application note is for geologists, environmentalists,
petroleum engineers, and others who use soil granulometry
as one important parameter for their studies. It demonstrates
an example of how the Beckman Coulter LS 13 320
can be applied to granulometry. An academic team used
the LS 13 320 to understand the deposition of soil
sediments in a Northwestern Chinese mountain range.

Introduction

Soil studies span a range of applications including agriculture,
architectural planning, and historical environmental studies3
.
Characterization of soils by particle size distribution
gives major insight into the deposition history of the sample.
Grain size is one of the indicators to understand how
soil formed (e.g., fluvial or loess deposits4,5). Fluvial
deposits are created from flowing water, including rivers
or streams, while loess deposits form from wind-blown
silt particles. Sedimentation rate6,7 and sieve analysis7
are two examples of the tools traditionally utilized
to determine size distribution of soils. Traditional methods
are time-consuming; they each have bias, mostly related
to the particles’ shape. Moreover, they require additional
tedious calculations to present the results in Phi notation.
None of these methods is a direct measurement of soil
particle size; all measure a property that is, at best,
tangentially related to particle size. Laser diffraction is a
superior option for soil sizing7,8. Worldwide, Beckman
Coulter laser diffraction instruments are successfully
applied in industry and academic research, obtaining
close correlation with earlier methods in sizing soils8
.
The latest instrument in the series, the LS 13 320,
yields highly reproducible results—and extremely fast
analysis—in Phi notation in a few seconds.

Study Background

Soil samples from the Bogda Mountains in Northwest
China were analyzed on the LS 13 320. The results
were presented by the Department of Geological Sciences and Engineering, Missouri University of Science
and Technology (MST). The data were part of a study
of mixed fluvial and loess deposits in an intra-continental
rift basin, the Mid-Permian Quanzijie Low-Order Cycle.
The Beckman Coulter Particle Characterization applications
scientists generated the data in collaboration with MST.
LS 13 320 results supported preliminary interpretation,
in support of the hypothesis that massive mudrock of
the Quanzijie (QZJ) Formation are loess deposits of an
eolian (wind-deposited) origin9
. Thirty-one samples
from the QZJ were analyzed with the LS 13 320 at various
locations throughout the basin (Lower, Middle, and Upper).
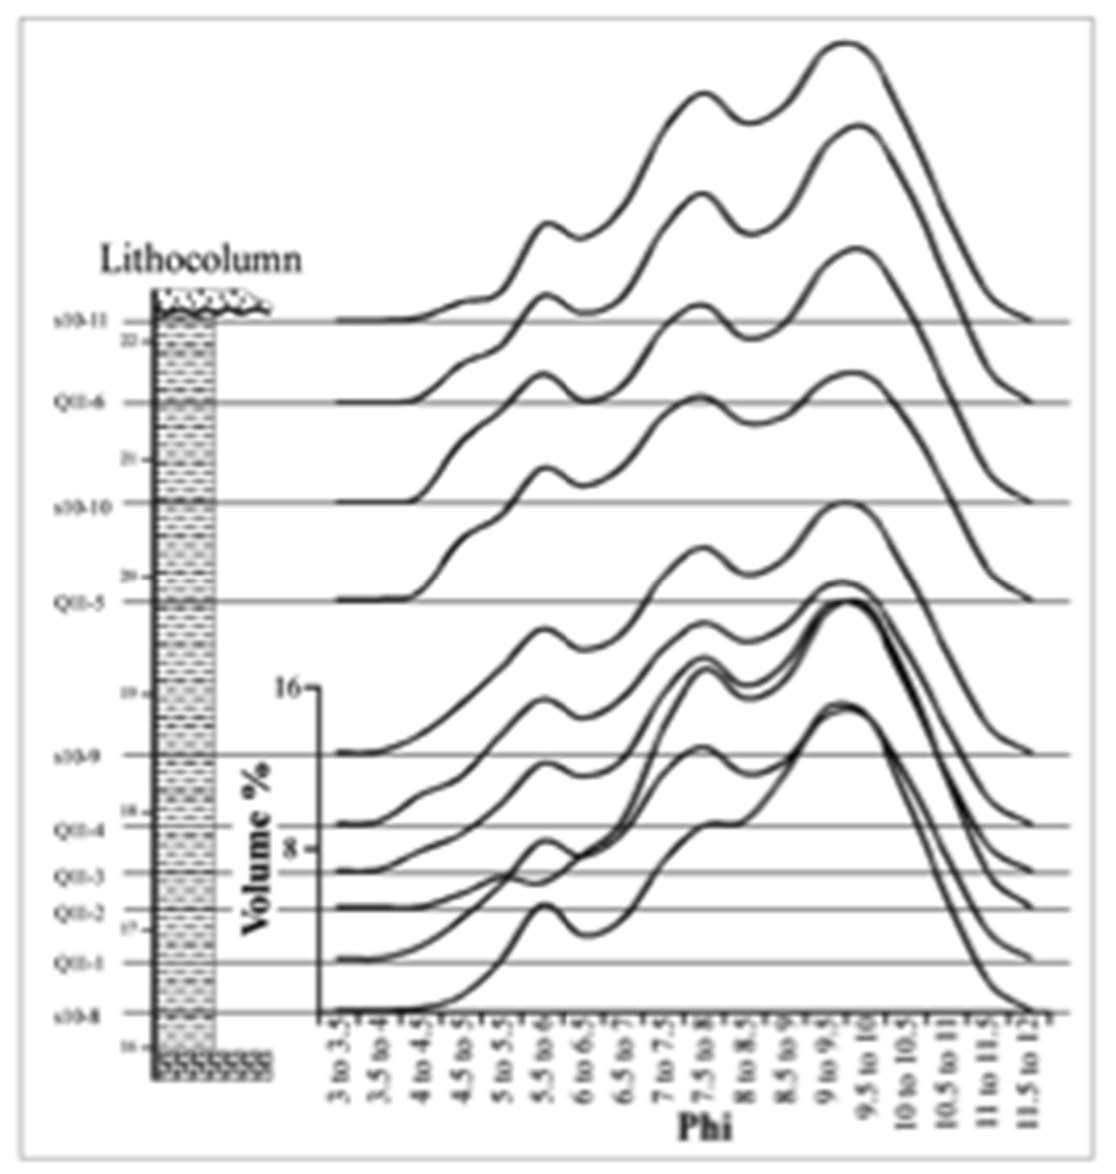
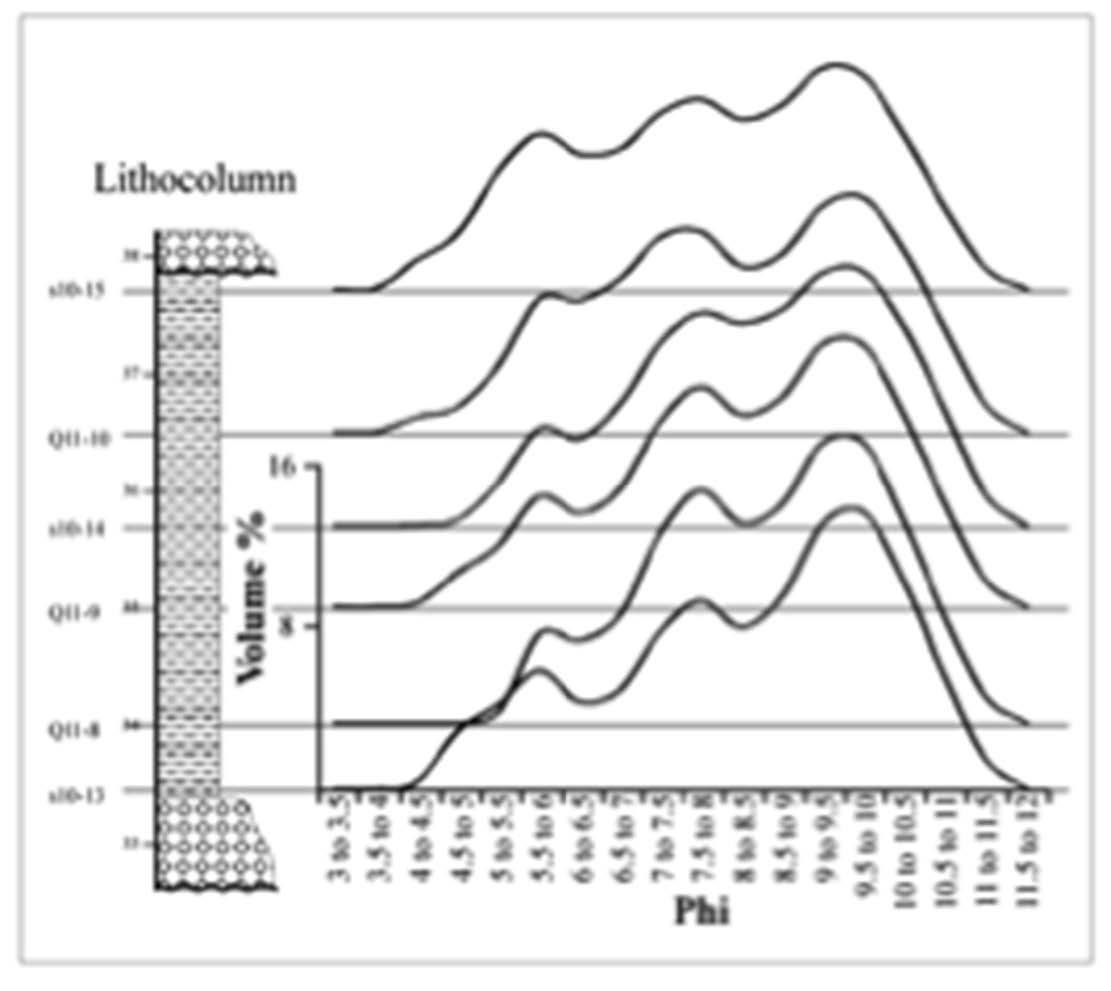
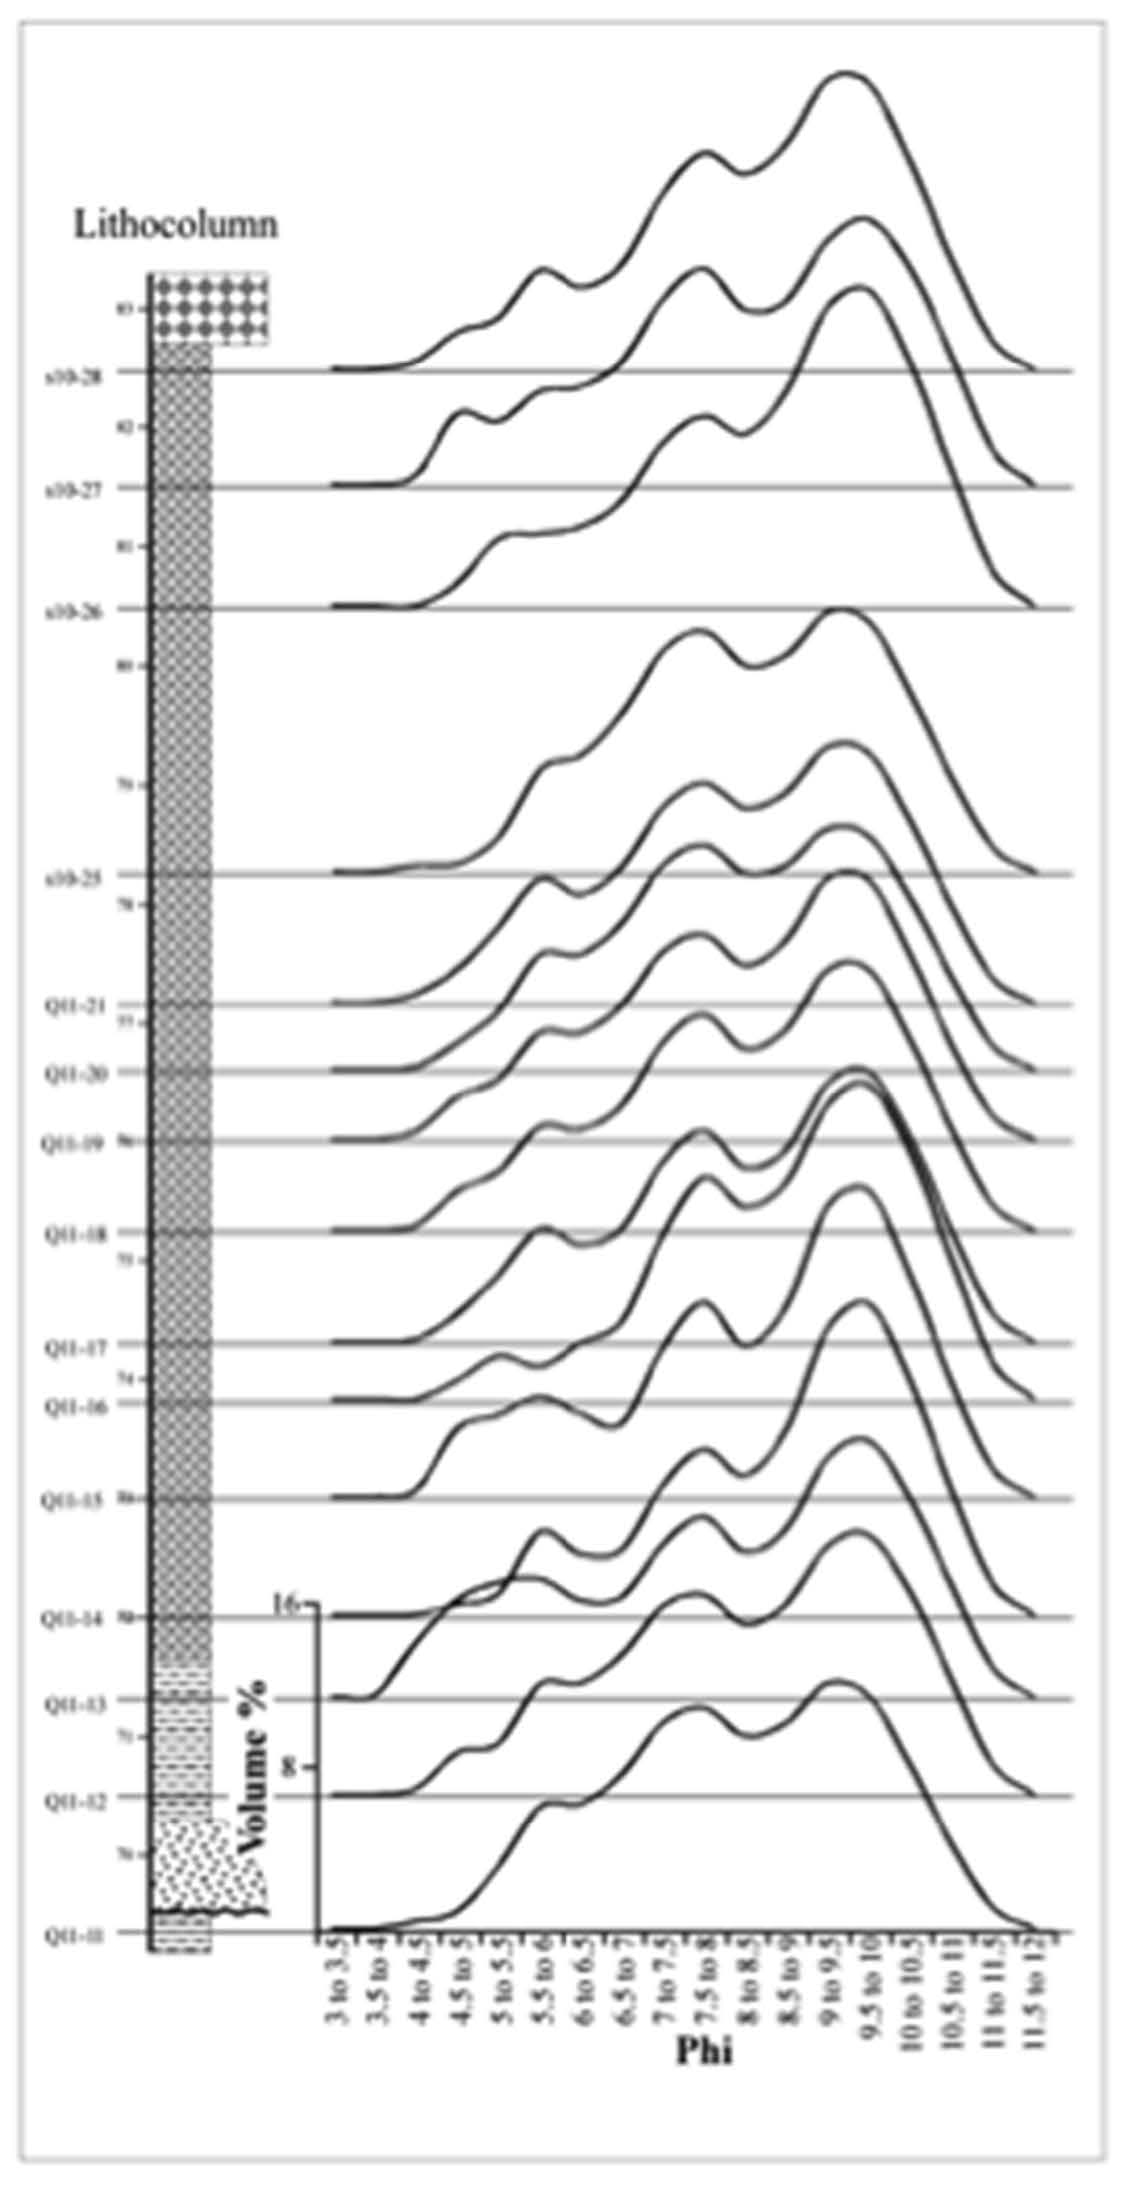
Interestingly, grain size remained roughly homogenous for
all samples regardless of lithocolumn (solid depth) location
(Figures 1–3). This is consistent with characteristics of
wind-deposited materials.

Method

  • In 150 mL beakers, one mL of 1M HCL was added
    to ~130 mg of each of the samples to loosen and
    disperse the soils.
  • Approximately 60 mL of DI water and one mL of
    10% calgon were added and probe-sonicated for
    four minutes at 100 W. The preparation beaker
    was placed into a 500 mL beaker with water to
    prevent boiling by prolonged sonication.
  • The entire content was added and rinsed into the
    LS 13 320 Aqueous Liquid Module (ALM) and run
    with a standard SOP

Results were reported using Folk & Ward Phi statistics
and graphs.

Conclusion

The LS 13 320 played a vital role in understanding the
mechanisms of deposition for soil samples in a Chinese
mountain range. The methods presented here have
frequently been used around the world in peer-reviewed
research publications—such as those presented in the
References section—as well as in private industry

Continue reading

Cement Application Note

Particle Size Distribution
Cement

Critical Particle Size Distribution for Cement using Laser Diffraction

“London Bridge is falling down….” Well not really, but only because the cement is still doing its good work! Producing high performance cement is directly related to maintaining a very specific Particle Size Distribution. Traditional size characterization methods include: Sieving using a 45μm sieve screen, Blaine Number measurement, and the Wagner turbidimeter measurement. These methods yield only a single number and are not sufficient to adequately characterize the crucial particle size distribution (PSD) of cement. Laser Diffraction is quickly becoming the method of choice as it yields a clear and accurate picture of the entire PSD.

Introduction

To say that the cement industry is big business may be the understatement of the decade! In 2014, the global cement production was approximately 4.2 billion metric tons1. Consider just the number of buildings, bridges, and roads that are built around the world every year using cement and you begin to get an idea of the magnitude of safety and quality considerations associated with its everyday use.
It is quite common to confuse cement with concrete, but in actuality, cement is a construction material used to produce concrete. There are many stages within the cement production process that require particle size characterization. Figure 1 below illustrates a typical cement production process. The most important point in the process to perform a Particle Size Distribution measurement is at the final product stage. The largest contribution to cement strength comes from particles smaller than 30μm, while particles smaller than 10μm contribute to the early curing stage and particles between 10-30μm have a larger impact at the later stage in the hardening process2. Generally speaking the larger the distribution percentage of particles between 3-30μm, the better the quality of the cement2. Experience tell us that the optimal size distribution is when 60-70% of particles in the overall distribution are within the range of 3-30μm and 10-20% are smaller than 3μm2. In the grinding process, overgrinding creates unnecessary costs; additionally it creates too many particles smaller than 3μm2. This phenomenon, in turn will produces too much heat during solidification, causes over sedimentation, which can further lead to quality issues like cracking. On the other hand, under-grinding will result in too many larger particles that in turn will prolong solidification time and can reduce overall strength.

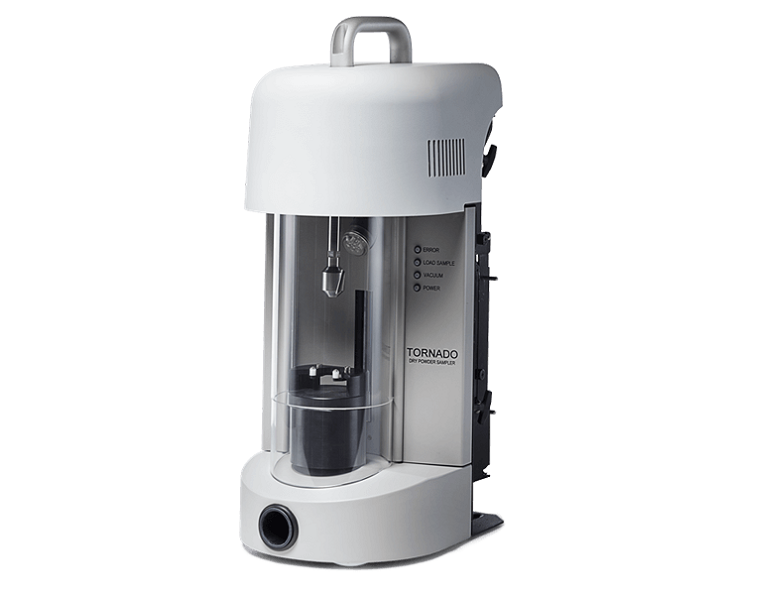
Laser diffraction has emerged as the preferred sizing method in cement industry due to its simplicity and accuracy as compared to the more traditional methods. Current laser diffraction users in cement industry have witnessed good correlation between wet (alcohol) or dry analysis using the Beckman Coulter Dry Powder System (Tornado™) This is illustrated clearly in the “Measurement of Particle Size Distribution in Portland Cement Powder: Analysis of ASTM Round Robin Studies: technical paper.

Results and Conclusions

To standardise characterisation of cement products using laser diffraction, NIST has issued a standard reference material (SRM) of Portland cement (NIST SRM 114q). In addition to listing the certified specific surface area values from Blaine and Wagner measurements and certified sieve residue values, the Particle Size Distribution of NIST SRM 114q is also specified using laser diffraction, both wet and dry analyses as the measurement techniques3. Beckman Coulter did not participate in the round robin analysis that determined the NIST SRM 114q size distribution. Fig. 2 details the analysis results of using a Beckman Coulter LS 13320 XR to characterize the NIST SRM 114q, both using both wet and dry methods. In the Certificate of Analysis, NIST specifies Simultaneous 95% Expanded Uncertainties for the Difference between a typical Laboratory and the Certified Value of SRM 114q3. The boundaries for the normal agreement are marked by two blue solid lines in Fig. 2 and the boundaries for the tighter agreement are marked by error bars at each data point in Fig. 2. As the graph clearly illustrates in Figure 2, both LS 13320 wet (Using the ULM module) and dry (using the Tornado Dry Powder System module) analyses resulted in excellent agreement, all well within the tighter limits, required by the NIST certification2.

References

  • 1. US and World Cement Production 2014 Retrieved from http://www.statista.com/statistics/219343/cement-production- worldwide/
  • 2. Guillermo Smart, AN-12784A BCPCS009LE LS-Cement
  • 3. Chiara F. Ferraris, Vincent A. Hackley, and Ana Ivelisse Avil´es Measurement of Particle Size Distribution in Portland Cement Powder: Analysis of ASTM Round Robin Studies.
    Retrieved from http://fire.nist.gov/bfrlpubs/build04/PDF/b04040.pdf

Continue reading

Soils and Sediments

Industrial
Information
Soils and Sediments

The importance of particle characterisation in Soils and Sediments

From the dirt beneath our feet to the sediment that lines the bottom of rivers and oceans, soils and sediments are vital parts of our environment. However, few of us give much thought to the tiny particles that make up these materials. 

By characterising particles, scientists can determine important factors such as porosity, permeability, and compaction, which are essential for understanding soil and sediment behaviour. This information is crucial for a wide range of applications, including agriculture, geotechnical engineering, environmental science, and mineral exploration. Various methods are used including sieving, microscopy, particle size analysis, and sedimentation techniques. These techniques provide valuable insights into the characteristics of the particles, enabling scientists to make informed decisions and predictions. Understanding particle characterisation is vital because it helps us comprehend the fundamental properties of soils and sediments. It allows us to better understand how these materials behave under different conditions, such as erosion, sedimentation, and nutrient retention. This knowledge is essential for developing effective soil management strategies, predicting natural hazards, and assessing the impacts of human activities on our environment.

Particle Size Analysis

 Soil studies span a range of applications including agriculture, architectural planning, and historical environmental studies. Characterisation of soils by particle size distribution gives major insight into the deposition history of the sample. Beckman Coulter laser diffraction instruments are successfully applied in industry and academic research, obtaining close correlation with earlier methods in sizing soils. The latest instrument in the series, the LS 13 320 XR, yields highly reproducible results—and extremely fast analysis—in Phi notation in a few seconds.

Case study

Particle characterisation plays a crucial role in various real-world applications, and numerous case studies have demonstrated its value in understanding soils and sediments.
One such case study involved the development of effective soil management strategies in agriculture. By characterising particles, scientists were able to predict nutrient retention and erosion, allowing for the implementation of measures to maximise crop yield and sustainability.
In geotechnical engineering, particle characterisation was instrumental in assessing soil stability and designing structures. Case studies showed that understanding particle characteristics helped evaluate the feasibility of construction projects and mitigate potential risks.

LS13320XR Particle Size Analyser Laser Diffraction Granulometer Particle Sizer

Instruments to support the Soils and Sediments industry

Applications to support your industry

Continue reading

Construction

Industrial Information
Construction

The importance fo Particle Characterisation in the Construction Industry

Particle characterisation is essential in the construction industry, as it is a key factor in determining the suitability of raw materials and components used to make buildings, bridges, roads and other structures. It involves analysing the physical characteristics of the particles, such as size, shape, surface area, porosity and density.

Meritics Particle Sizing solutions for Construction

Meritics provides tailored particle size analysis solutions for construction, optimising material quality and ensuring consistent particle size distribution to enhance the durability and performance of construction projects.

Using Flow Imaging Microscopy to analyse particle shape for the Construction Industry

Meritics offers specialised particle shape analysis solutions for construction, enabling precise characterisation of aggregate shapes to enhance material performance and optimize construction processes.

Surface Area Analysis using BET Analysers

Meritics delivers surface area analysis solutions for construction, facilitating accurate assessment of material surface properties to optimise performance and durability in construction applications.

Density analysis solutions for the Construction industry

Meritics provides density analysis solutions for the construction industry, enabling precise measurement of material density to ensure compliance with specifications and optimise construction material performance.

Case study

We specialise in building high-quality roads and highways for various clients. Ensuring the proper composition of construction materials is crucial for the durability and performance of our roads.

One of the challenges we faced was achieving consistent and optimal particle size distribution in our construction aggregates, particularly in materials such as crushed stone and gravel used in asphalt and concrete mixtures. Variations in particle size distribution can impact the workability, strength, and longevity of the pavement.

To address this challenge, we decided to integrate particle size analysis into our quality control process. Meritics helped us to choose the Bettersizer 2600 as it has modules for both wet and dry methods of analysis. By accurately measuring and monitoring the particle size distribution of our construction aggregates, we are able to ensure compliance with specifications and improve the overall quality of our roads.

Instruments to support your industry

Applications to support your industry

Continue reading

Pigment Application Note

Particle Size Distribution
Pigments

Using Laser Diffraction Analysis in Pigment Sizing

Introduction

Pigments and paints are an important class of industrial
materials. They play an important role and
can be found in everyone’s lives. From cosmetics to
car paint, from household paint to the ink in the
humble ballpoint pen or the ubiquitous inkjet printer,
nobody today will fail to encounter a wide variety
of pigments and paints in their daily routine.

The application properties of a given pigment/
paint system are determined largely by the particle
size distribution of the pigment particles. Particle size
determines the tinctorial strength or the depth of
color (neglecting self-scattering of the pigment);
additionally, it may also be an important physical
parameter of the pigment system itself. For example,
in printing inks, it is important that the ink particles
are not larger than the nozzle delivery system that
dispenses the ink.

The ability of a given pigment to absorb light
(tinctorial strength) increases with decreasing particle
diameter, and accordingly increased surface
area, until it reaches a point when the particles become
translucent to the incident light. This one factor alone
makes the measurement of particle size critical to
the performance for many of today’s pigment applications.

The LS™ Series multi-wavelength particle size
analyzers from Beckman Coulter, Inc. utilize a complementary
scattering technology for the sizing of
sub-micron particles. This technical note describes, by
reference to real samples, how pigment particles are
sized using the PIDS™ system (Figure 1).

Sizing pigments using laser diffraction analysis

A variety of particle sizing technologies have been
employed to measure the particle size distributions
of pigment systems. But, laser diffraction has
increasingly become the most commonly employed
technique in the determination of particle size distributions.
The acceptance of the technique stems from
its ease of use and the varied ways that samples can
be presented to the system for analysis.

A sample of interest is illuminated by laser light
of a given wavelength. The technique relies upon
the fact that the particles will scatter light when
exposed to electromagnetic radiation. The resulting
scattering pattern can be measured electronically
and then deconvulated mathematically to infer a
particle size distribution.

The ease of use coupled with a short analysis
time, typically less than one minute, has made laser
diffraction, as stated earlier, the primary method by
many companies for process control. However, there
is a drawback: a majority of pigment systems are
sub-micron in nature and this is the size range where
standard laser diffraction instruments have typically
struggled to provide accurate information.

It is important to first understand why laser diffraction
particle size analyzers have difficulties sizing
sub-micron materials. When illuminated by a
laser beam, large particles scatter light strongly at
small angles and with readily detectable maxima
and minima in the scattering pattern. This means
that detectors placed at small angles, relative to the
optical path and with sufficient angular resolution,
can detect the fine detail in the scattering pattern.
It is the accurate measurement of these maxima
and minima that allows the determination of the
mean size of the material being analyzed and the
width and detail of the distribution.

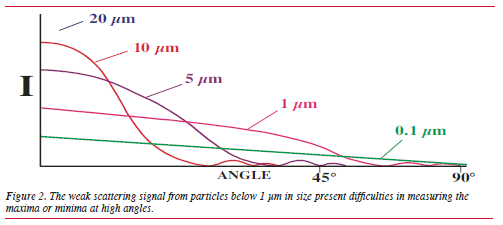
Conversely, small particles scatter light weakly
and without any discernible maxima and minima
until high angles of measurement are reached. As
can be seen in Figure 2, once there are particles
below 1 μm, many difficulties in the measurment
are encountered with weak scattering signals.

Different manufacturers have adopted different
solutions to overcome these limitations with varying
degrees of success. Most early efforts have focused
on the measurement of back-scattered light, and
indeed some manufacturers continue to pursue this
approach. In the early 1990s, Beckman Coulter
devised a novel technique for enhancing sub-micron
sizing in standard laser diffraction systems. This
involved the utilization of additional wavelengths
apart from the main diffraction laser source. The
technique is called PIDS,™ for Polarization Intensity
Differential Scattering.

PIDS

The technology employed in PIDS is simple and takes
advantage of the well-established and understood
Mie theory of light scattering.

PIDS (Polarization Intensity Diferential
Scattering) relies upon the transverse nature of light,
i.e., it consists of a magnetic vector and an electric
vector at 90 degrees to it. If, for example, the electric
vector is “up and down,” the light is said to be
vertically polarized.

When we illuminate a sample with light of a
given wavelength and polarization, the electric field
establishes a dipole. The oscillations of the electrons
in this dipole will be in the same plane of
polarization as the propagated light source. The
oscillating dipoles in the particles radiate light in all
directions except that of the irradiating light source.

PIDS takes advantage of this phenomenon. Three
wavelengths – 450 nm, 600 nm, and 900 nm –
sequentially illuminate the sample, first with vertically
and then horizontally polarized light. The
scattered or re-radiated light from the sample is
then measured over a range of angles. By analyzing
the differences between the horizontally and the vertically
polarized light for each wavelength, we can
gain information about the particle size distribution
of the sample. It is important to remember that we
are measuring the differences between the vertically
and the horizontally polarized signals, and not simply
the values at a given polarization.

The intensity vs. scattering angle information
from the PIDS signals is then incorporated into
the LS algorithm from the intensity vs. scattering
angle data from the primary laser, giving a continuous
size distribution, 0.04 μm to 2,000 μm
(Beckman Coulter LS™ 230 and LS 13 320).
The technique has proven to be extremely accurate
for the sizing of both spherical and non-spherical
sub-micron particles.

Other manufacturers have begun to utilize
multi-frequency wavelength analysis for sub-micron
analysis, typically using just one additional wavelength,
though they do not adopt the same approach
as is taken for PIDS.™ While providing extra data, it
does not offer the same amount or level of detailed
information that is offered by PIDS technology. The
extra wavelength is normally provided by a blue
light source with a wavelength of approximately
460 nm. By shortening the wavelength, gains are
made by primarily ensuring a larger light flux signal
is generated compared to the standard laser light
source, thereby making its quantification easier.
Secondly, by using a shorter wavelength, the difference
between the small particles are minimalized, in
terms of size and the wavelength of the illuminated
light source; this is an important parameter for standard
diffraction analysis. Diffraction data, in effect,
stops being meaningful as particles get smaller in
relation to the wavelength that is irradiating them.

The Problem with Pigments

,p>Pigments provide a unique problem not encountered
with most materials that are measured using laser
diffraction instruments. The vast majority of samples
measured on commercially available instruments
are not colored and this makes their analysis more
straightforward. It is important to consider why this
is the case. For an accurate particle size to be calculated,
both the real refractive index of the material
and its imaginary component must be known. This
becomes more important for small particles as the
mathematical treatment to successfully size them
becomes the more rigorous Mie theory.

While the real refractive index is a value that is
well understood by the majority of analysts, the
imaginary component is less so. It is, in fact, the
degree of absorbance that is exhibited by the sample
at a given wavelength. Non-colored materials exhibit a
fairly uniform absorbence across the ultra violet/
visible (UV/Vis) electromagnetic spectrum.

Pigments, however, provide an entirely different
challenge. The reason they are colored lies with the
fact that they absorb certain wavelengths preferentially.
This must be taken into account when calculating
the particle size distribution, particularly if the
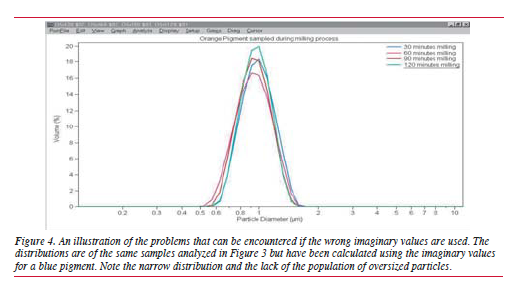
particles are small. For example, how will a blue
pigment with an absorbance maximum at 630 nm
interact with a helium neon laser (wavelength
633 nm), which is the choice of a number of manufacturers
for their primary laser light source? The material essentially behaves as a black body, which
must be taken into account during optical modeling.
Failure to do so will lead to significant errors that
will increase with a decrease in particle size.

The real refractive index remains an important
function and can be either calculated or estimated
from known constants, and any error associated
with this can be minimized.

Thus, it is easy to see that the quantification of
the imaginary component of the complex refractive
index is extremely important for the accurate determination
of pigment particulate systems.

Determining the Imaginary
Component

The determination of the imaginary component of a
pigment is a relatively straightforward measurement.
It is achieved using a UV/Vis spectrophotometer,
which measures the relative absorbency of a material
per given wavelength. It is this preferential absorbtion
that dictates the color of a material.

Two things must be taken into account: first,
one must ensure that no large particles are present
in the spectrophotometer sample cell, as they will
give rise to forward scatter and will “blind” the
detector, compromising the absorbance measurement.
It may be necessary to filter a sample to remove large
particles; particles should be no bigger than a few
microns.

Second, the relative amount of absorbtion must
be taken into account in the calculation of the optical
model. This will not be a constant and will need to
be determined for each type of instrument. Once this
has been done, these values can then be used when
calculating optical models for a given pigment.

In terms of the allowance used for the imaginary
component, the approach taken for each complementary
wavelength needs to be fully evaluated.
A novel approach related to the obscuration value,
which is associated directly with the amount of
sample in the analyzer, can be employed. A more
sophisticated method would be to use Beer’s Law.
However, one would need to know the exact concentration
of the solution. But, absorbencies taken
at a specific concentration could then be directly
related to one another. The more quantitative
approach would be to determine the exact concentration
of the solution.

Each manufacturer takes a different approach to
the calculation of optical models. Beckman Coulter
allows users to calculate a complete Mie theory optical
model for a given sample. The optical model can be
generated with the latest version of software in as
little as three seconds.

Using Complementary Information

When analyzing pigments, it is also beneficial to
utilize other sources of information to initially verify
or confirm the results obtained. Once correlating
information has proven the suitability of a given
model for a particular sample it can then be used
with confidence for that material. The best sources
of correlating information are photomicrographs.
These can be images from simple microscopes to
electron microscopes. This approach is particularly
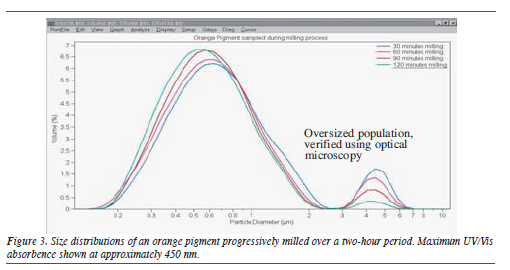
important for the detection of small amounts of oversized
materials. This can be a common problem with
many pigment systems due to the type of size reduction
or milling techniques utilized. Ball mills can give
rise to small amounts of oversized materials that may
remain undetected by laser diffraction, particularly
if the imaginary component of the refractive index
is not taken into account.

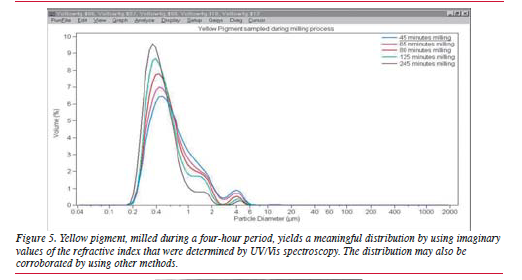
Beckman Coulter, working in conjunction with
a selected number of pigment manufacturers, has now
gained valuable experience in the particle size
analysis of many different pigment systems. The
applicability of an optical model for a given pigment
is best determined if one tracks a milling process over
time. If the correct refractive index values have been
used to create the optical model, one should obtain
a constant reduction of the mean size.
The Question of Shape

A criticism leveled at all laser-based particle sizing
devices is that they make no allowance for the shape
of the materials under test, regardless of the size of
the particles. The reasons for this lie with the underlying
assumptions, used in calculating size distributions
from the raw data generated during the analysis.

The mathematical models used to calculate distributions
are based on scattering of light by a
sphere. So any reported distribution is, in effect, an
equivalent spherical distribution of the material being
analyzed. In most instances this is quite adequate
since most particles approximate to a spherical system
adequately enough.

Particles in milled pigments will not be perfect
spheres, so how does this affect their recovered
sizes using the technique described above? The
ideal way to evaluate this is with reference to
known standards.

Until recently, sourcing suitable sub-micron,
non-spherical particles for studies of this type has
been difficult because of the lack of independently
produced and assayed materials. However, the colloid
chemistry department at the University of
Utrecht now produces a variety of mono-dispersed,
non-spherical materials. Figure 6 shows the results
obtained for the analysis of sub-micron hematite
spindles (spheroids).

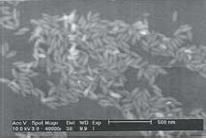
The size of the particles (determined by SEM,
or scanning electron microscopy) is 46.9 nm in
width and 130.8 nm in length, giving them an
approximate aspect ratio of 3:1. The particles are
mono-sized and are readily dispersed.
LS™ Series Particle Size

Distribution for Hematite spindles
The optical properties of the hematite spindles have
been determined from UV/Vis spectroscopy for the
imaginary component of the refractive index and
from UV/Vis spectroscopic ellipsometry data for the
real component. Using hematite has an added benefit,
in that being a colored material it mimics a pigmented
material well.

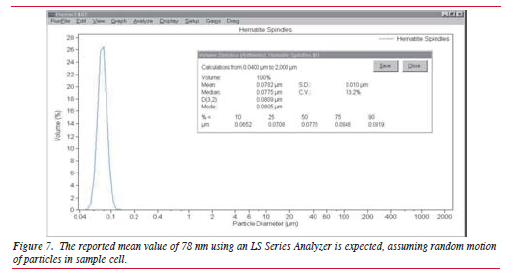
The reported value for the mean size from the
LS Series Analyzer is 78 nm (Figure 7), which is
well with in the range of what one would expect
given the random motion of the particles in the sample
cell. Statistically, one would expect the reported mean
size to be a function of all the possible orientations
of the particles as they traverse through the illuminated
beam. Indeed, instruments are designed to
ensure that particles in the sample cell are orientated
in a random manner with regard to their morphology
or shape.

Summary

If the right approach is taken, enhanced multi-frequency
laser diffraction can be employed successfully
to size particulate pigment systems.

For pigments, steps can be taken to determine
the imaginary component of the optical model for
laser diffraction particle size analyzer. It is also
worthwhile considering using other techniques to
initially corroborate the results obtained.
Continue reading

Have questions or need support?

1. Get in Touch

Tell us about your application and particle characterisation needs.

2. Have a conversation

We're happy to set up a call to discuss your application and answer your questions.

3. Discuss next steps

Expand your knowledge with a seminar, demonstration, sample analysis, or obtain a quote.

We are here in the UK to help and
answer any questions you might have.
Call us directly on +44 1582 704807

© 2024 Meritics.com